


Authors:
(1) Mahdi Goldani;
(2) Soraya Asadi Tirvan.
Table of Links
Abstract and Introduction
Methodology
Dataset
Similarity methods
Feature selection methods
Measure the performance of methods
Result
Discussion
Conclusion and References
Measure the performance of methods
After selecting the most relevant variables and creating a suitable subset, the performance of each of the selected subsets was measured using A 10-fold cross-validation method. This method divided the one dataset randomly into 10 parts. The 9 parts out of 10 parts are used for training and reserved one-tenth for testing[18]. This process was repeated 10 times, reserving a different tenth for testing. During this process, the linear regression model is used for training and testing.
In statistics, linear regression is a statistical model that estimates the linear relationship between a scalar response and one or more explanatory variables. The case of one explanatory variable is called simple linear regression; for more than one, the process is called multiple linear regression. This term is distinct from multivariate linear regression, where multiple correlated dependent variables are predicted, rather than a single scalar variable. If the explanatory variables are measured with error, then errors-in-variables models are required, also known as measurement error models. a linear regression model assumes that the relationship between the dependent variable y and the vector of regressors x is linear.


This relationship is modeled through a disturbance term or error variable ε — an unobserved random variable that adds “noise” to the linear relationship between the dependent variable and regressors [19]. Linear regression identifies the equation that produces the smallest difference between all the observed values and their fitted values. To be precise, linear regression finds the smallest sum of squared residuals that is possible for the dataset.
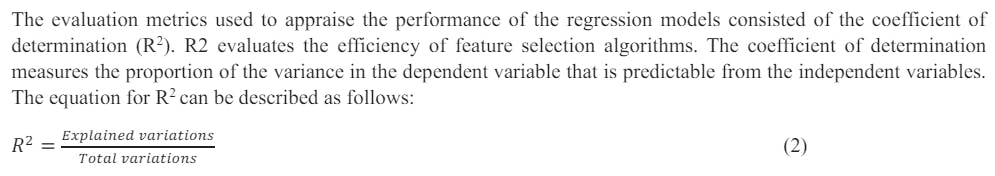


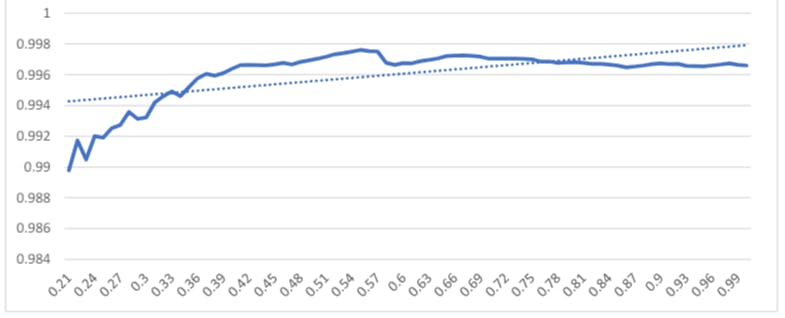
R-squared evaluates the scatter of the data points around the fitted regression line. It is also called the coefficient of multiple determination for multiple regression. For the same data set, higher R-squared values represent smaller differences between the observed data and the fitted values.
The approach of this article is to identify methods of feature selection and similarity that have the best performance in small data sizes. For the discussion of feature selection, in addition to the methods proposed in the research method, there are many methods in the research literature, including the combined methods that are more accurate in many cases. However, the main aim of this study is to identify methods that are computationally simple in addition to selecting the most suitable subset of data. Therefore, methods were chosen that did not have computational complexity
This paper is available on arxiv under CC BY-SA 4.0 by Deed (Attribution-Sharealike 4.0 International) license.


