


Social media metrics tell you what’s actually working on social – and what’s just noise. But with so much data available, it’s easy to track everything but learn nothing.
This guide breaks down the 21 social media metrics that matter most so you can report smarter, pinpoint areas to improve, and build a winning social media strategy.
Key Takeaways
- Social media metrics give you insight into how audiences respond to your content.
- Engagement is a strong signal that your content is landing. Likes, comments, and shares indicate that your audience is connecting with your content.
- Audience metrics reveal who you’re reaching. Metrics like follower growth, demographics, and sentiment help you understand (and better serve) your audience.
- Conversion metrics connect social to results. Clicks, conversions, and CTR show how social media drives actions like sign-ups and sales, making ROI easier to track.
Social media metrics are data points that measure how well your social media strategy is performing across platforms. They measure how people discover your content, interact with it, and take action.
Social media metrics help you measure:
- Engagement: Does the content resonate?
- Awareness: How do people see your content? And how far does it travel?
- Conversions: Does the content motivate action?
- Growth: Is your audience expanding over time?
They’re often mixed up with KPIs, but here’s the difference: metrics measure what happened, while KPIs tie those results back to specific business goals.
Tracking social media metrics is important because it helps you make better decisions about your content, spend, and strategy.
Social media metrics help you:
- Evaluate your performance. Metrics are like scorecards for your content. They show which posts resonate and which ones miss, so you can optimize your content strategy over time.
- Make smarter strategy decisions. Social media metrics reveal trends in engagement, reach, and growth, and that info can help you adjust your posting times, formats, and channels in real time.
- Connect social activity to business results. The right metrics show how social contributes to traffic, sign-ups, revenue, and other business goals, making it easier to justify the time and spend.
- Spot problems earlier. Metrics make it possible to identify downward trends, like declining engagement or reach, before they snowball into bigger issues.
This isn’t about vanity metrics. Strategic social media planning requires consistent measurement to guide decisions and prove impact.
The social media metrics that matter most are the ones that support your goals.
That’s right: instead of tracking everything, narrow down your primary goals, then focus on the metrics that prove you’re getting there. Here’s a handy cheat sheet:
| Goal | Metrics to track |
| Brand awareness | Reach, impressions, and share of voice |
| Engagement | Likes, comments, shares, and engagement rate |
| Growth | Follower count and follower growth rate |
| Conversions and ROI | Click-through rate (CTR), conversion rate, cost per click (CPC), cost per thousand impressions (CPM), sign ups, downloads, and leads |
| Customer experience | Average response time, net promoter score (NPS), customer satisfaction (CSAT), and sentiment |
Once you know your social media goals, the easier it is to focus on the metrics that matter. Keep reading for a complete list of the essential social media metrics to track in 2026.
We’ve broken down the 21 key social media metrics you need to keep an eye on. Follow along to gain a better understanding of each metric and learn how to track it.
- Engagement metrics
- Reach metrics
- Conversion metrics
- Audience metrics
- Video performance metrics
- Customer service metrics
Engagement metrics
Engagement metrics show how often people interact with your content and how strongly it resonates with your audience.
High social media engagement is an obvious telltale that people like your content, but it also puts you in favor with many social media algorithms, which can push your reach even further.
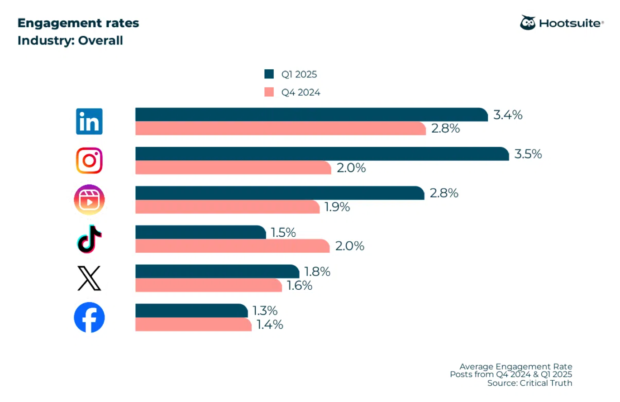
1. Engagement rate
Engagement rate shows how strongly your content resonates relative to your audience size. It’s one of the most reliable indicators of whether your content is actually connecting, not just getting seen.
There are multiple ways to calculate engagement (in fact, we have a dedicated article on all the ways to do it).
One of the most common methods is to add up your total likes, comments, shares, and saves, then divide that number by your total followers and multiply by 100.
Note: If you’re calculating engagement for your entire account, be sure to include data from all published posts.
For campaigns, only include the social media posts tied to that campaign.If you want to skip the math (we don’t blame you), you can also use our free engagement rate calculator to measure engagement by post, account, or campaign.
Pro tip 💡: This metric is most useful when you stack it up against benchmarks. Engagement rates can swing a lot depending on the platform, industry, and audience size. Take a look at engagement rate benchmarks to see how yours stacks up.

2. Likes and reactions
Likes and reactions show how often someone paused mid-scroll to interact with your post. While they’re sometimes called vanity metrics, they still play a big part in your engagement rate and give you a quick read on what’s landing.
For example, on platforms like Facebook and LinkedIn, reactions can help you gauge actual sentiment about each post. Are people laughing? Do they support your content?
At a baseline, likes and reactions show how often your content resonates enough to make someone pause and interact, even briefly. Track them over time by week or month to spot trends and make sure engagement is moving in the right direction.
3. Comments
Comments are one of the strongest signals of real engagement. Tapping “like” is easy, but taking the time to write a comment means your content sparked a thought, an opinion, or a question.
They also give you valuable feedback. Comment sections are often full of ideas, objections, and insights from your audience. That makes comments a powerful metric for judging how well your posts are resonating.
Trish Riswick, Social Media Manager at Hootsuite, echoes this: “The comment section is filled with inspiration and feedback, but it’s also a great metric to track as it demonstrates the effectiveness of your posts and the increase in love from your followers.”
Track comment volume over time to spot growth. As your audience becomes more invested in your brand, you should see more conversation showing up under your posts.
4. Shares
Shares are one of the clearest signals that your content hit the right note. When someone shares a post, they’re putting their name behind it and passing it along to their own circle.
People usually share content because it makes them feel something. As Riswick explains, “In our 2024 Consumer Report, we asked why people share content on social. The biggest reason (44%) is because people agreed with the post. 29% of respondents said they shared something because they found it informative. While 24% said it was because a post was inspirational.”
Keep track of how many shares your content gets over a certain time period to make sure it’s growing. If you ever see a drop in shares, go back to see what type(s) of content receive the most shares, and create more of that content.
Reach metrics
Reach metrics show how many people see your content and how much attention your brand gets on social media.
These are important metrics to pay attention to because they help you get an idea of how large your online audience is.
5. Reach
Reach is simply the number of people who see your content.
It’s a good idea to monitor your average reach, as well as the reach of each piece of content you publish, including posts, stories, and videos. You can even measure the overall reach of your account.
A valuable subset of this metric is to look at what percentage of your reach is made up of followers vs. non-followers. If a lot of non-followers are seeing your content, that means it’s being shared or doing well in the algorithms, or both.
6. Impressions
Impressions show how often your content appears on screen, helping you understand frequency and visibility beyond unique viewers.
You can measure impressions by post, as well as the overall number of impressions on your social media profile.
Impressions can be higher than reach because they count the number of times your content is viewed, even if it’s by the same person.
An especially high level of impressions compared to reach means people are looking at a post multiple times. Do some digging to see if you can understand why it’s so sticky.
7. Social share of voice (SSoV)
Social share of voice measures how many people are talking about your brand on social media compared to your competitors. How much of the social conversation in your industry is all about you?
Mentions can be either:
- Direct (tagged — e.g., “@Hootsuite”)
- Indirect (untagged — e.g., “hootsuite”)
Essentially, SSoV is like a competitive analysis: how visible (and therefore relevant) is your brand in the market?
Not sure where to start? Hootsuite’s versatile social media management and listening tool can help with that. Psst: It’s included in every free trial plan.


Listening Basics allows you to monitor conversations, SSoV, keywords, mentions, and hashtags, taking the guesswork out of your marketing.
Want to go the manual way? Add up every mention of your brand on social media across all networks, then do the same for your competitors.
Add both sets of mentions together to get a total number of mentions for your industry. Divide your brand mentions by the industry total, then multiply by 100 to get your SSoV as a percentage.
Conversion metrics
Conversion metrics show how effectively your social media efforts drive desired actions, including clicks, sign-ups, and purchases.
While conversion is often used in advertising, being able to find these measurements organically is just as important.
8. Conversion rate
Conversion rate measures how often your social content leads to a conversion (think: sign-up, download, or sale).
This is one of the most important social media marketing metrics because it shows the value of your social media campaigns (organic and paid) in feeding your funnel.
UTM parameters are the key to making your social conversions trackable. Learn how they work in our blog post on using UTM parameters to track social success.
Once you’ve added your UTMs, calculate conversion rate by dividing the number of conversions by the number of clicks.
9. Click-through-rate (CTR)
Click-through rate, or CTR, indicates how often people click a link or call-to-action in one of your posts. That could be anything from a blog post to your online store.
CTR gives you a sense of how many people saw your social content and wanted to see more. It’s a good indicator of how well different types of content promote your brand on social media.
To calculate CTR, divide the total number of clicks for a post by the total number of impressions. Multiply by 100 to get your CTR as a percentage.
For more tips on optimizing your content, check out this guide on zero-click content.
10. Cost-per-click (CPC)
Cost-per-click, or CPC, is the amount you pay per individual click on a social ad.
Knowing a customer’s lifetime value for your business or even the average order value will help you put this number in an important context.
A higher customer lifetime value combined with a high conversion rate means you can afford to spend more per click to attract visitors to your website in the first place.
You don’t need to calculate CPC: You can find it in the analytics for the social network where you’re running your ad. However, the formula is easy enough: divide your advertising cost by the total number of clicks.
11. Cost per thousand impressions (CPM)
Cost per thousand impressions, or CPM, is exactly what it sounds like. It’s the cost you pay for every thousand impressions of your social media ad.
CPM is all about views, not actions.
Again, there’s nothing to calculate here — just import the data from your social network’s analytics.
Audience metrics
Audience metrics help you understand who your followers are, how your audience is growing, and how people feel about your brand. This is critical for improving your messaging and working on growth.
Here are the metrics to watch out for:
12. Follower count
Follower count is the number of followers you have on each platform. It’s a handy metric to track if you’re trying to grow your audience.
Riswick says, “What was once thought as a vanity metric was proven by our team this year to be very important. We found that 70% of people who follow a brand on social have explicit plans to make a purchase from them soon or in the future. Out of all the metrics, follower growth is also just a nice and quick way to see how your social media efforts are working.”
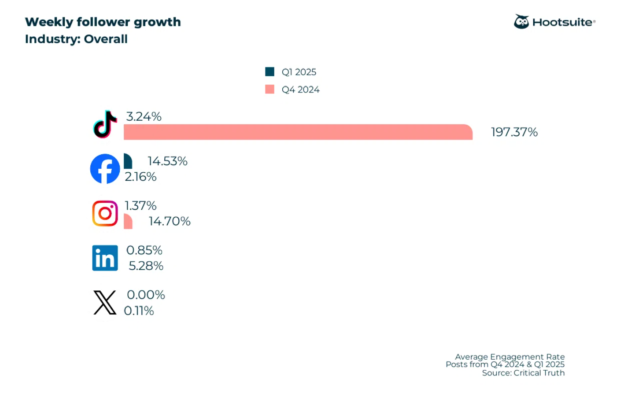
13. Follower growth
Your follower growth measures how many new followers your brand gets on social media within a certain amount of time.
It’s not a simple count of your new followers. Instead, it measures your new followers as a percentage of your total audience. So, when you’re just starting out, getting 10 or 100 new followers in a month can give you a high growth rate.
But once you have a larger audience, you need more new followers to maintain that momentum.
To calculate your follower growth rate, keep tabs on net new followers (for each social media platform) over a reporting period. Then, divide that number by your total audience (on each platform) and multiply by 100. That’s your audience growth rate.

14. Social media sentiment
Social media sentiment looks at how people feel when they talk about your brand online. Beyond likes and comments, sentiment shows whether the conversation is positive, negative, or somewhere in between.
Calculating social sentiment requires some help from a social media metrics tool that can process and categorize language and context. We’ve got a whole post on how to measure sentiment effectively.


15. Demographics
Audience demographics give you the deets about who your followers are.
Things like their basic makeup (gender identity, age, location) and some of their online behavior — like when they’re online— can be found within your social media analytics.
Demographics can help inform your strategy, find the right times to post, and direct your marketing messaging.
Video performance metrics
Video metrics measure how people watch and engage with your video content across social platforms.
Posting video content on YouTube and other social media channels? You’ll need to pay attention to these video-specific KPIs.
16. View count
A “view” doesn’t mean the same thing on every platform. In most cases, it only takes a few seconds of watch time for a view to count.
Here’s how the major platforms define it:
- YouTube: At least 30 seconds
- Facebook: At least 3 seconds
- Instagram: At least 3 seconds
- TikTok: As soon as your video starts playing
View count works best as a quick pulse check. It tells you how many people stopped scrolling long enough to give your video a chance.
17. Video completion rate
Video views are great, but they only let you know that someone started to watch your video. So, how often do people actually watch your videos all the way through to the end? That’s where video completion rate comes in.
Video completion rate is a good indicator that you’re creating quality content that connects with your target audience. It’s also a positive signal to many social media algorithms, so this is a good one to focus on improving.
18. Watch time
Watch time refers to the total time viewers spend watching your video content.
It’s one of the clearest signals of real interest, telling you whether viewers are watching all the way through or dropping off early.
Tracking watch time over time helps you spot what holds attention and what’s helping your video performance grow.
Customer service metrics
Customer service metrics show how well your team responds to and supports customers through social channels.
Take a look at the following customer service metrics:
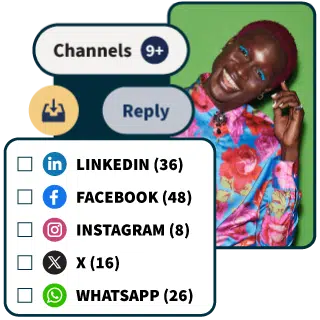
19. Average response time
Response time is a metric that measures how long it takes for your customer service team to respond to queries that come via social channels – mainly DMs. Think of it as the social media equivalent of time spent on hold.
Using AI customer service bots can significantly reduce response time for many repeat requests.If you’re using a social customer service tool like Hootsuite Inbox, you can add response time directly to your analytics report.


Otherwise, you can calculate it manually by adding up the total time taken for an initial response to customer queries and dividing it by the number of queries.

Reduce response time (and your workload)
Manage all your messages stress-free with easy routing, saved replies, and friendly chatbots. Try Hootsuite’s Inbox today.
Book a Demo
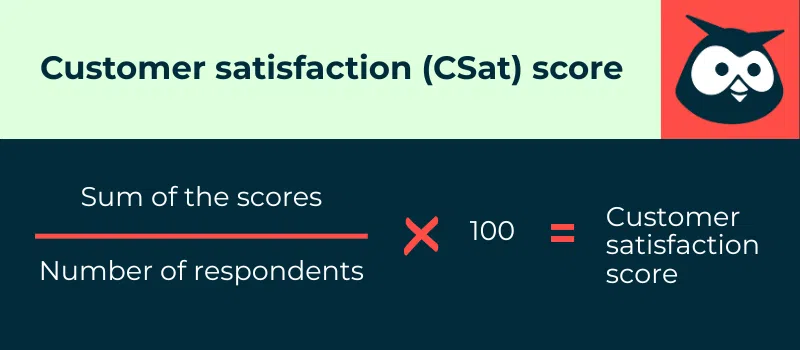
20. Customer satisfaction (CSAT) score
CSAT (customer satisfaction score), is a metric that measures how happy people are with your product or service.
Usually, the CSAT score is based on one, straightforward question: How would you rate your overall level of satisfaction? In this case, it’s used to measure the level of satisfaction with your social customer service.
It’s why so many brands ask you to rate your experience with a customer service agent after it’s over. And that’s exactly how you can measure it, too.
Create a one-question survey asking your customers to rate their satisfaction with your customer service and send it via the same social channel used for the service interaction. This is a great use for bots.
The formula: Add up all the scores and divide the sum by the number of responses. Then multiply by 100 to get your CSAT score as a percentage.

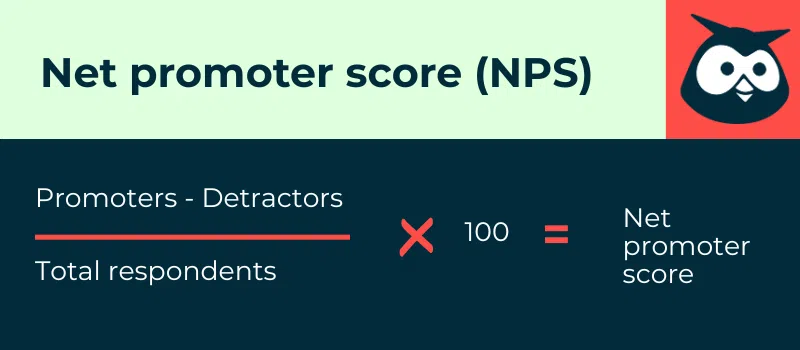
21. Net promoter score (NPS)
Net promoter score, or NPS, is a metric that measures customer loyalty.
Unlike CSAT, NPS is good at predicting future customer relationships. It is based on one — and only one — specifically phrased question: How likely would you recommend our [company/product/service] to a friend?
Customers are asked to answer on a scale of zero to 10. Based on their response, each customer is grouped into one of three categories:
- Detractors: 0–6 score range
- Passives: 7–8 score range
- Promoters: 9–10 score range
NPS is unique in that it measures customer satisfaction as well as the potential for future sales, making it a valuable go-to metric for organizations of all sizes.
To calculate NPS: subtract the number of promoters from the number of detractors. Then, divide the result by the total number of respondents and multiply by 100 to get your NPS.
Psst: For more details, check out our post that dives deep into customer service metrics.
Are you looking to organize all your social media metrics so that you can easily create reports for your team? Here are four helpful tools to help you organize and manage all your social metrics:
1. A social media report template
First, if you’re a spreadsheet lover, why not just own it? There’s nothing wrong with using a basic spreadsheet and social media report template to manually track your stats and autofill formulas you’ve set up.
With your own tracking spreadsheet, you’ll want to include:
- Each metric you choose to track
- Each individual platform you’re tracking
- Graphs that help visualize growth
Or, give yourself a head start by downloading our free social media analytics report template. Simply fill in the blanks – it’s really that simple.
2. Hootsuite
Hootsuite’s social media dashboard is an incredible tool for tracking your social media metrics and compiling them into a digestible report.

#1 Social media tool
Create. Schedule. Publish. Engage. Measure. Win.
Free 30-day trial
Here’s how to use Hootsuite Analytics to set up a social media metrics dashboard that calculates and measures your metrics for you.
- Log in to your Hootsuite dashboard and head to the Analytics tab.
- Click New Report. Scroll through the various reporting options and templates to create a custom report template based on the metrics you care most about. Note: once you add these metrics to your social media metrics dashboard, you don’t need to remember the formulas anymore because Hootsuite will calculate them for you.
- Head to the Benchmarking section on Analytics and click Competitive Analysis. Choose your social profiles and add competitors to compare your performance to the competition.
- Also under the Benchmarking section, click on Industry, then choose your industry to benchmark your performance against your industry as a whole. This is the tool we used to gather the benchmarks listed throughout this post.
- Track your social media customer service metrics using the Team Activity tab.
3. Talkwalker
Talkwalker is a consumer intelligence platform that has its own Hootsuite app so that you can use it with your Hootsuite account.
With the tool, you get advanced social listening features so that you can monitor your brand mentions and sentiment across a number of online platforms and publications.


This can be hugely helpful for both your audience and customer service metrics. Make sure you have a finger on customer sentiment so you always know how your brand is being perceived.
4. Meta Business Suite
Finally, the Meta Business Suite is a good option for smaller businesses that might not yet have the budget to take advantage of third-party software. If you have a presence on platforms like Facebook and Instagram, Meta Business Suite is the perfect analytics solution.
Connect your Facebook Page and Instagram business account to use the singular Meta dashboard to access your analytics, messages, and more.
So why is it important to monitor your social media metrics? Why do they matter? Well, it’s because understanding your overall performance is key to improving your social media marketing strategy.
This means you can grow your online presence faster, increase your social media ROI, and increase brand awareness. And who doesn’t want that?
By paying attention to your social media metrics, you can pinpoint exactly what content types and topics your audience is most interested in. After all, those will have a higher reach and more engagement than posts that don’t quite hit the mark.
You can also use your metrics to identify trends and patterns. Is there a certain product or service that tends to get more attention online than others?
Not only can you work to promote that product or service more often, but you also may consider offering similar new options because obviously, what you’re already doing is popular.
And finally, your metrics help you better understand your audience and what they like. Pay attention to your comments, read and respond, watch for popular content, and analyze online brand mentions.
And apply everything that you learn to your existing social media strategy. A strategy is a living document, always changing based on one thing: your analytics. This is why knowing which social media metrics to track is key to social media success.
Bonus: Get a primer on social strategy and measurement from our free ebook on social media marketing basics. Grab it below (no email required)!
What are the best social media scheduling tools for enterprise teams?
The best social media scheduling tools for enterprise teams are platforms that support multiple networks, large user groups, and complex workflows, like Hootsuite. Enterprise teams need tools that handle scale, approvals, analytics, and security in one place, not just basic post scheduling.
How do you compare social media scheduling tools for large organizations?
When comparing social media scheduling tools, start by looking at how well they support scale, governance, and collaboration. Key things to look at include approval workflows, permissions, reporting depth, and how easily teams can manage content across regions.
What features do enterprise marketers need in a social media scheduling tool?
Enterprise marketers need a social media schedule tool that offers approval flows, shared content calendars, asset management, and strong analytics. Bonus points if the tool also offers best times to post, social listening, and cross-platform reporting to support smarter planning – like Hootsuite.
How do scheduling tools streamline global social content workflows?
Scheduling tools streamline global workflows by centralizing planning while still giving local teams room to publish. They make it easy to coordinate across time zones, reuse approved content, and keep everything on brand without endless back-and-forth.
How do you evaluate social scheduling tools for governance and approvals?
To evaluate governance, look for tools with built-in approval workflows, clear permission levels, and audit trails. These features help enterprise teams control what gets published, reduce risk, and keep brand standards consistent across every account.
Track your social media performance and maximize your budget with Hootsuite. Publish social media content and analyze the results in the same, easy-to-use dashboard. Try it free today.

