


Table of Links
Abstract and 1. Introduction
-
Background
2.1 Rollup
2.2 EIP-4844
2.3 VAR(Vector Autoregression)
-
Data
3.1 Consensus security data
3.2 Ethereum usage data
3.3 Rollup Transactions Data
3.4 Blob gas fee data
-
Empirical Results
4.1 Consensus security
4.2 Ethereum usage
4.3 Rollup transactions
4.4 Blob gas fee market
-
Conclusion and References
A. Consensus Security Data
B. Rollup Data Collection
C. Detailed Var Model Results for Blob Gas Base Fee and Gas Fee
D. Detailed Var Model Results for Blob Gas Base Fee and Blob Gas Priority Fee
E. Rollup Transaction Dynamics
A CONSENSUS SECURITY DATA
This appendix presents a detailed evaluation of the consensus security data after the implementation of EIP-4844.
A.1 Overall change of consensus metrics
Table 7 shows the comparative metrics before and after the implementation of EIP-4844. The values in parentheses represent the increase excluding the impact of slots with zero blobs. The data reflects an increase in the metrics post-4844, with fork rate witnessing a noticeable increase. The synchronization time (Sync time), although showing a significant increase in average, only about half of this increase can be confidently attributed to the impact of EIP-4844. It was observed that CSP time and DA time did not significantly affect sync time, whereas receive time had a major impact.
A.2 Detailed analysis of consensus metrics
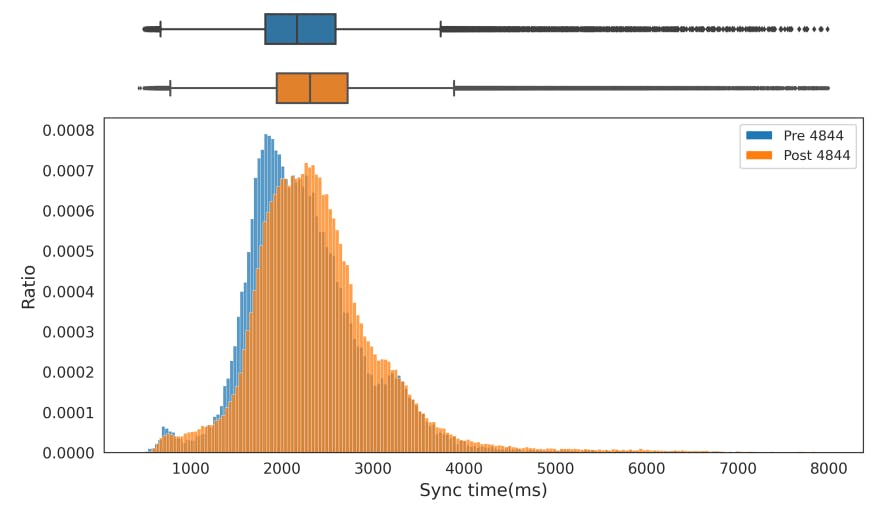
Figure 17 illustrates the distribution of sync time for slots before and after the enactment of EIP-4844. The box plots provide a visual comparison, while the histogram offers a distribution perspective, highlighting the shift towards slow synchronization times post4844.
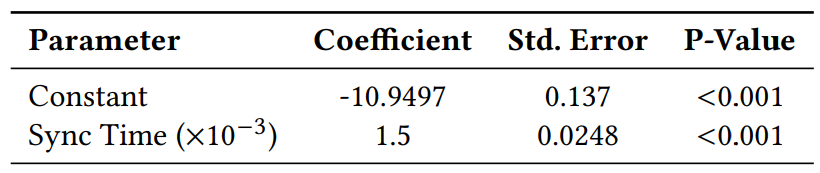
Table 8 presents the results of a logistic regression analysis, which investigates the impact of synchronization time on the likelihood of a slot forking. The positive coefficient of 1.5 indicates that as synchronization time increases, the log odds of observing the fork also increase, suggesting a proportional relationship.
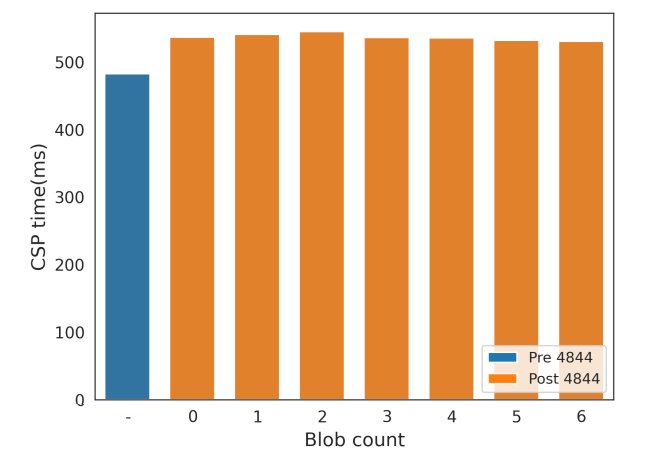
Figure 18 analyzes the average CSP time by the number of blobs. The bar chart contrasts the average time taken for consensus proposals with varying blob counts before and after the implementation of EIP-4844. The comparison suggests that while there is an increase in CSP time post-4844, it is difficult to conclusively attribute this increase to the effects of EIP-4844.


B ROLLUP DATA COLLECTION
B.1 Rollup data sources
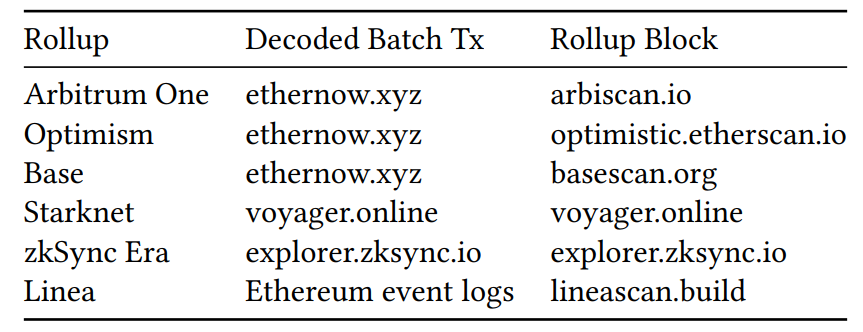
Table 9 represents data sources of decoded batch transactions and blocks of rollups. Combining this data with 9, we completed a detailed our dataset including transaction delay and L2 transaction data.

B.2 Rollup function classification
Table 10 represents the classification of rollup transactions based on their functionality and sender addresses. We investigated 10 rollups and their functions frequently used, and classified them to two parts: if they use Ethereum as DA layer or not.
:::info
Authors:
(1) Seongwan Park, this author contributed equally to the paper from Seoul National University, Seoul, Republic of Korea (sucre87@snu.ac.kr);
(2) Bosul Mun, this author contributed equally to the paper from Seoul National University, Seoul, Republic of Korea (bsbs8645@snu.ac.kr);
(3) Seungyun Lee, Seoul National University, Seoul, Repulic of Korea;
(4) Woojin Jeong, Seoul National University, Seoul, Repulic of Korea;
(5) Jaewook Lee, Seoul National University, Seoul, Repulic of Korea;
(6) Hyeonsang Eom, Seoul National University, Seoul, Repulic of Korea;
(7) Huisu Jang (Corresponding author), Soongsil University, Seoul, Republic of Korea.
:::
:::info
This paper is available on arxiv under ATTRIBUTION-NONCOMMERCIAL-NODERIVS 4.0 INTERNATIONAL license.
:::


