


Table of Links
Abstract and 1 Introduction
1.1 The twincode platform
1.2 Pilot Studies
1.3 Other Gender Identities and 1.4 Structure of the Paper
2 Related Work
3 Original Study (Seville Dec, 2021) and 3.1 Participants
3.2 Experiment Execution
3.3 Factors (Independent Variables)
3.4 Response Variables (Dependent Variables)
3.5 Confounding Variables
3.6 Data Analysis
4 First Replication (Berkeley May, 2022)
4.1 Participants
4.2 Experiment Execution
4.3 Data Analysis
5 Discussion and Threats to Validity and 5.1 Operationalization of the Cause Construct — Treatment
5.2 Operationalization of the Effect Construct — Metrics
5.3 Sampling the Population — Participants
6 Conclusions and Future Work
6.1 Replication in Different Cultural Background
6.2 Using Chatbots as Partners and AI-based Utterance Coding
Datasets, Compliance with Ethical Standards, Acknowledgements, and References
A. Questionnaire #1 and #2 response items
B. Evolution of the twincode User Interface
C. User Interface of tag-a-chat
3.5 Confounding Variables
The confounding variables that were controlled during both studies are described below.
3.5.1 Subject’s technical skills
To control the variability caused by each subject on their partner, pairs were kept the same during the entire experiment, although the subjects were not informed about this fact. Ideally, this would make the conditions of the two in-pair tasks the same except for the programming exercises (see below) and for the induced gender in the case of the experimental group.
3.5.2 Programming exercises
In order to avoid potential differences among the programming exercises used during in-pair tasks, they were all of similar complexity and were randomly assigned.
3.6 Data Analysis
The data analysis was performed only for those subjects considered as valid according to the following criteria: (i) to have filled in both questionnaires; (ii) to have their metrics correctly collected by the twincode platform; (iii) to have been paired with another valid subject; and (iv) not to have disclosed their gender or their partner’s during the in-pair exercises;
This resulted in 46 pairs, i.e. 92 valid subjects, with only 9 subjects dropped because of technical problems with their connections to the twincode platform, as previously mentioned in Section 3.1.
3.6.1 Correlation between Induced and Perceived Gender
Before analyzing between and within-group relationships, the correlation of the induced and perceived gender in both groups was analyzed in order to know whether the treatment had been effectively administered to the subjects[7].


For that purpose, the results of the contingency table in Table 4 were analyzed observing that the percentage of subjects who were induced to think that their partner was a man and that effectively remembered they saw a man avatar was close to 61%, whereas in the case of woman avatars the percentage was close to 59%. Although Cramer’s V for Table 4 showed a large effect (0.709) according to [23], we decided to exclude from the remaining analyses those subjects in the experimental group for whom the induced and perceived gender did not match, because we considered that the treatment had not been sufficiently effective in their cases[8]. On the other hand, we kept those subjects in the control group who did not perceived any gendered avatar or did not remember it, discarding the rest. As a result, we kept all the subjects in the control group (39 men, 6 women, 1 non-binary) but only 27 (21 men, 6 women) in the experimental group.
3.6.2 Between-groups Analysis
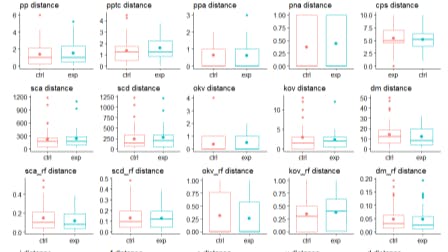
In the analysis between the control and experimental groups, for every response variable v except for cps[9], we computed the distance between the two in-pair tasks as the absolute value of the difference, i.e. v(t2) − v(t1) , since the sign of that difference was not relevant in our case. In our research hypothesis, this distance should be smaller for the students in the control group, who received no information about their partners’ genders i.e. no treatment, than for those in the experimental group who effectively perceived two different partners’ genders at t1 and t2. Therefore, for every response variable except for cps, we performed a one-tailed unpaired mean difference test between groups, applying a t-test or a Mann-Whitney U test (also known as Wilcoxon test), depending on the results of the normality assumption tests.
In the case of the cps variable, for the control group we expected the mean to be closer to the middle point (5) between the first and second partner, as they were unconsciously comparing the skills of the same person. For the experimental group, we expected the mean to be skewed towards 0 (partner perceived as a man) or 10 (partner perceived as a woman) due to the effect of the treatment. Therefore, to detect differences between groups for the cps response variable, we performed an unpaired two-tailed t-test because data distribution was not significantly different from normal distribution.
Contrary to our research hypothesis, no significant differences were observed at α=0.05 between the control and experimental groups for any of the 45 response variables described in Section 3.4, including cps. The corresponding boxplots are depicted in Figure 7, where it can be seen that the difference between means—the circles in the boxes—in both groups were very small.
3.6.3 Within-groups Analysis
Within the experimental group, we wanted to analyze whether there were differences between the response variables when the same subjects perceived theirs partners as men or women according to our research hypothesis. We also wanted to study the possible interaction between the perceived partner’s gender and the subject’s gender.
For those purposes, we performed a two-sided paired mean difference test for every response variable except for cps, using the perceived gender (ppgender) as a within-subjects variable, and applying a t-test or a Wilcoxon test depending on the results of the normality assumption tests. For studying the interaction, we performed the corresponding mixed-model two-way ANOVAs with the perceived gender (ppgender) as a within-subjects variable and the subject’s gender (gender) as a between-subjects variable.
For the cps variable, which passed the Shapiro-Wilk normality tests, we analyzed whether the subject’s gender had any effect when comparing partners perceived as man or woman by means of a two-tailed unpaired t-test between groups, using gender as a between-subjects variable.
Contrary to our research hypothesis, no significant differences were observed at α=0.05 between the two levels of the ppgender variable for any of the 44 response variables described in Section 3.4. None of the 44 ANOVA tests detected any significant interaction either, and no effect of the subject’s gender on the cps variable was detected.
As depicted in Figure 8, the corresponding boxplots show very small differences between means when partners are perceived as men or women in the experimental group.
Authors:
(1) Amador Duran, I3US Institute, Universidad de Sevilla, Sevilla, Spain and SCORE Lab, Universidad de Sevilla, Sevilla, Spain ([email protected]);
(2) Pablo Fernandez, I3US Institute, Universidad de Sevilla, Sevilla, Spain and SCORE Lab, Universidad de Sevilla, Sevilla, Spain ([email protected]);
(3) Beatriz Bernardez, I3US Institute, Universidad de Sevilla, Sevilla, Spain and SCORE Lab, Universidad de Sevilla, Sevilla, Spain ([email protected]);
(4) Nathaniel Weinman, Computer Science Division, University of California, Berkeley, Berkeley, USA ([email protected]);
(5) Aslıhan Akalın, Computer Science Division, University of California, Berkeley, Berkeley, USA ([email protected]);
(6) Armando Fox, Computer Science Division, University of California, Berkeley, Berkeley, USA ([email protected]).
[7] The analysis of the correlation between induced and perceived gender was not included in the registered report originally submitted to ESEM’2021 [16]. We included it thanks to the reviewers’ comments, whose suggestion has definitely improved our analysis.
[8] We applied this strict selection of subjects in the experimental group in a manner consistent with the results of the correlation analysis, considerably reducing the number of subjects, especially in the replication reported in Section 4.
[9] As commented in its description in Section 3.4.1, the cps variable is measured only once at the end of the experimental process, since it compares first and second partners’ skills.


