


Table of Links
Abstract and I. Introduction
-
Materials and Methods
2.1. Multiple Instance Learning
2.2. Model Architectures
-
Results
3.1. Training Methods
3.2. Datasets
3.3. WSI Preprocessing Pipeline
3.4. Classification and RoI Detection Results
-
Discussion
4.1. Tumor Detection Task
4.2. Gene Mutation Detection Task
-
Conclusions
-
Acknowledgements
-
Author Declaration and References
3.4. Classification and RoI Detection Results
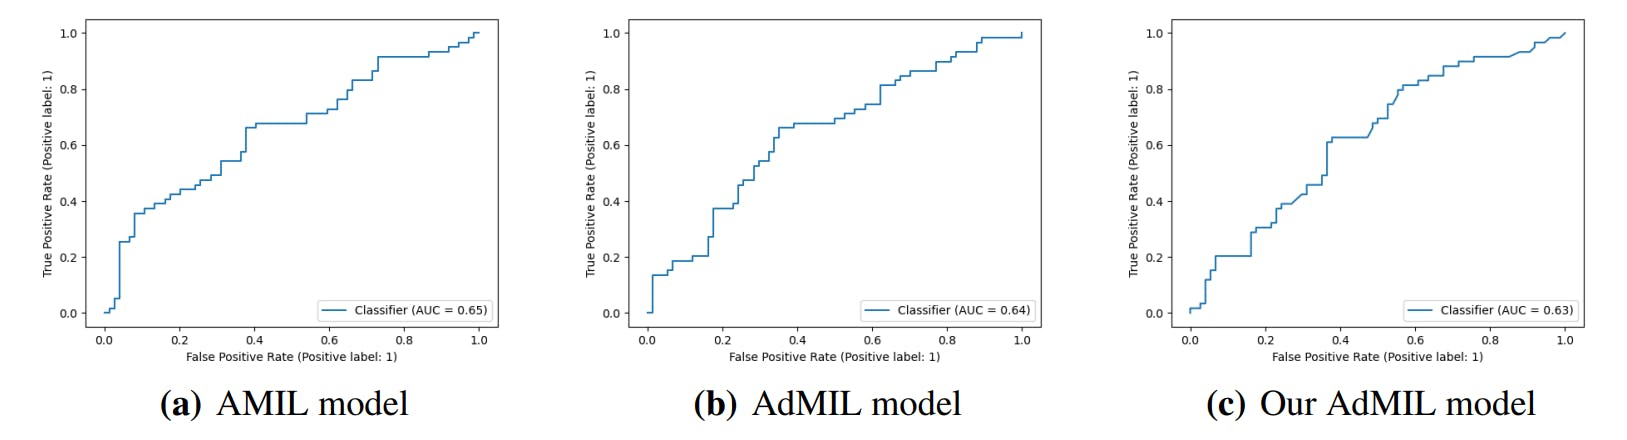
In this section, we present the results obtained for our classification tasks, as well as some examples of the RoIs produced by the models. After fine-tuning, we performed, for each model, task, and magnification level, five independent runs where the datasets were randomly split with different seeds. Tables 1 and 2 display the average and standard deviation of the Areas under the Curves (AUCs) obtained on the test set for those five runs. We also present graphs displaying the ROC curves of one of these runs for each model, task and magnification.
Table 1 shows the AUC results for the tumor detection task at magnification 5x. Figure 7 shows an example of the heatmaps produced for the tumor detection task in a slide at the same magnification level. Table 2 presents the gene mutation detection task AUC results at magnification levels 5x, 10x and 20x. Figures 8 and 9 present examples of heatmaps produced for the gene mutation detection task from patches of magnification 10x and 20x. Due to the poor classification results obtained at magnification 5x, we did not include heatmaps from this level, since we concluded that they would not be meaningful.
For the AMIL model we only have the attention scores, corresponding to the patches that were considered the most relevant for the final prediction. Regarding the original AdMIL and our version, we have the patch attention scores produced by the attention layer, as well as the excitatory and inhibitory patch scores, that indicate positive and negative contributions for the final prediction, respectively. These final scores were passed through a sigmoid to scale the logits to values between 0 and 1, where values in the interval ]0, 0.5[ indicates a negative contribution and values in [0.5, 1[ a positive contribution. In the case of attention heatmaps, we show a continuous colormap. For the inhibitory/excitatory scores, we only use two colors, one for the excitatory patches (Red) and other for the inhibitory patches (Blue).


Authors:
(1) Martim Afonso, Instituto Superior Técnico, Universidade de Lisboa, Av. Rovisco Pais, Lisbon, 1049-001, Portugal;
(2) Praphulla M.S. Bhawsar, Division of Cancer Epidemiology and Genetics, National Cancer Institute, National Institutes of Health, Bethesda, 20850, Maryland, USA;
(3) Monjoy Saha, Division of Cancer Epidemiology and Genetics, National Cancer Institute, National Institutes of Health, Bethesda, 20850, Maryland, USA;
(4) Jonas S. Almeida, Division of Cancer Epidemiology and Genetics, National Cancer Institute, National Institutes of Health, Bethesda, 20850, Maryland, USA;
(5) Arlindo L. Oliveira, Instituto Superior Técnico, Universidade de Lisboa, Av. Rovisco Pais, Lisbon, 1049-001, Portugal and INESC-ID, R. Alves Redol 9, Lisbon, 1000-029, Portugal.
This paper is available on arxiv under CC by 4.0 Deed (Attribution 4.0 International) license.

