


When you open a mobile app to check the weather, you see beautifully visualized maps with clouds, rain, or thunderstorms. But where does this information come from? In this article, I’ll explain how weather data travels from complex meteorological systems to your smartphone, focusing on the technical details.
How Weather Radars and Satellites Work
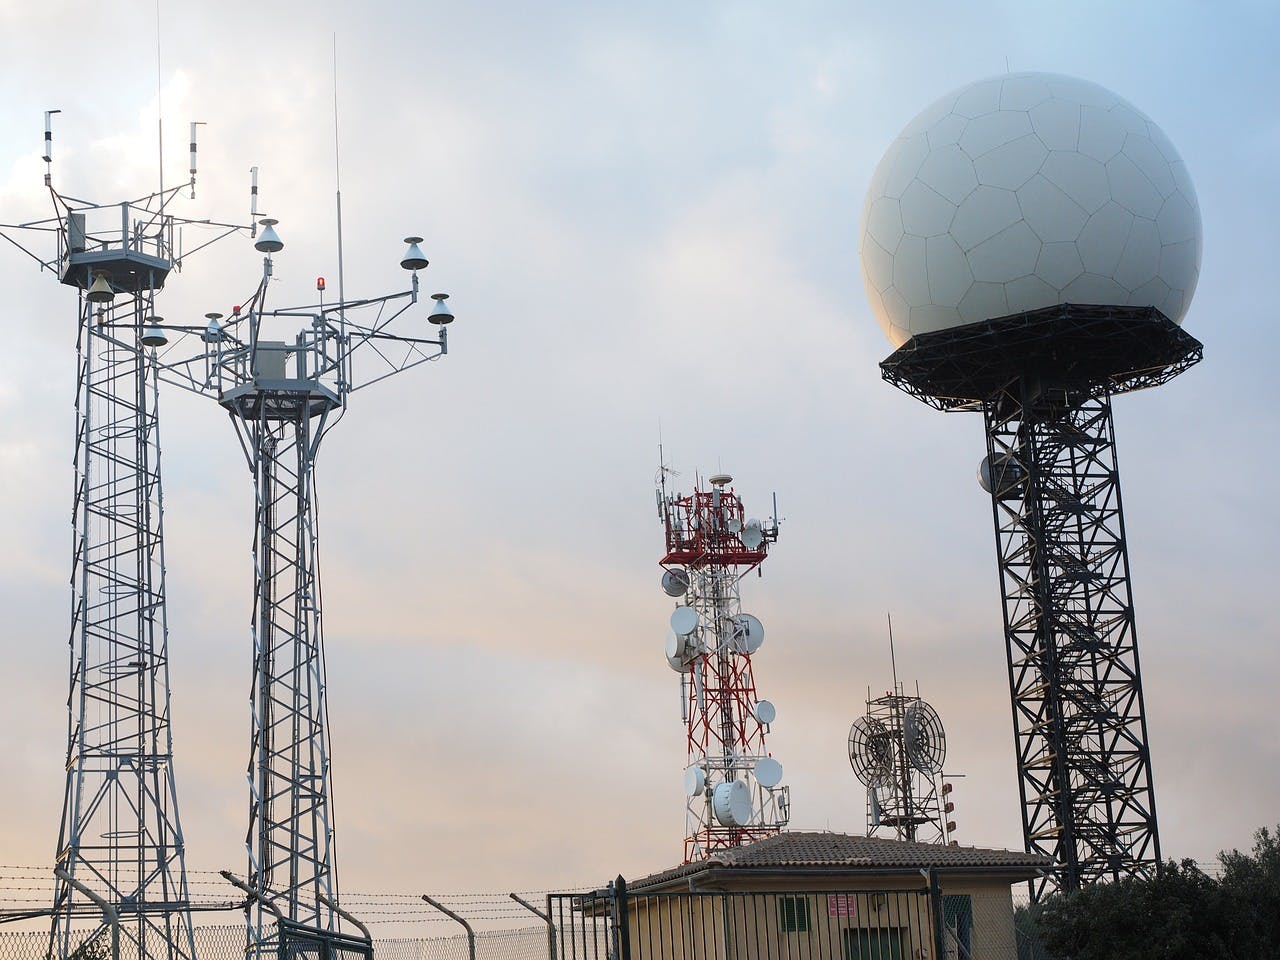
Modern meteorological systems rely on two primary data sources: ground-based radar networks and meteorological satellites. Each system generates distinct data streams with specific technical characteristics:
Satellites orbit Earth in two main ways: staying fixed over one spot (geostationary) or moving over the poles (polar). They capture different types of images—visible, infrared, and water vapor—to monitor cloud dynamics, sea surface temperatures, and even wildfire smoke plumes. For example, Europe’s latest Meteosat satellites have 50 times better resolution than older models, while Japan’s Himawari-8 updates every 2.5 minutes for rapid cyclone tracking.
Radars, such as Doppler systems, emit microwaves that bounce off precipitation. By measuring phase shifts in returning signals, they calculate rainfall intensity, wind speed, and storm rotation. Unlike legacy rotating radars, newer solid-state phased arrays (deployed in countries like Canada and Australia) scan entire skies in seconds, improving tornado detection.
The Journey of Data from Radar to Mobile App
Collecting information
Satellites generate terabytes of data hourly, while radar networks (like Europe’s OPERA) pulse every 5–10 minutes. Lidar and ground-based sensors (e.g., IoT-enabled weather stations) add hyperlocal humidity and wind metrics.
Processing and cleaning
Raw data is noise-filtered using Fourier transforms and Kalman filters. For example, radar echoes from birds or buildings are scrubbed via machine learning models trained on historical patterns. Satellite imagery is calibrated for atmospheric distortion, which is critical for aligning infrared data with ground truth.
Transmission to central servers
National weather services (e.g., NWS, Met Office, DWD) transmit processed or semi-processed data to their servers. Mobile apps then pull this information via APIs or dedicated pipelines. The data formats vary:
- Raw: Unprocessed radar reflectivity (NetCDF, GRIB2) or satellite spectral bands (HDF5).
- Graphical: Pre-rendered maps (JPEG/PNG) for quick visualization, often used by legacy systems.
Analysis and integration into weather services
On Rain Viewer’s side, data (raw or graphical) undergoes rigorous processing:
-
Projection alignment: Raw radar/satellite data (often in Lambert Conformal or Polar Stereographic projections) is reprojected to Web Mercator using GDAL to match web mapping standards.
-
Nowcasting: PySTEPS—an open-source library for probabilistic nowcasting—analyzes motion fields from radar sequences. It applies optical flow algorithms to extrapolate precipitation trajectories, generating 3-hour forecasts at original radar or satellite resolution.
Updating the weather map on your smartphone
Processed data is sliced into 512x512px WebP tiles (90% smaller than PNG) with adaptive quantization to balance pixelation and load times. GPU-accelerated rendering stitches tiles into seamless animations, while edge caching via Cloudflare ensures sub-100ms latency during peak traffic. For example, Rain Viewer’s radar layer updates every 5 minutes globally, even during severe weather events.
Is Real-Time Weather Data Possible?
Many people think that radar images in apps show the weather “here and now.” This is almost true, but there can still be delays due to physical and technological limitations:
- Radar latency: Most modern phased-array radars achieve sub-60-second scan times, but data validation adds 20–30 seconds. Older “outdated” radars typically require 30–40 seconds per scan.
- Satellite delays: Geostationary satellites stream every 30 seconds, but processing 12-channel spectral data takes 8–10 minutes.
- Model lag: Even GPU-accelerated Numerical Weather Prediction (NWP) requires 2–3 minutes per simulation cycle.
The development of artificial intelligence and big data will reduce these delays in the future, making forecasts even more accurate and faster.
What’s Next? The Future of Weather Technology
In the next 10–15 years, expect:
- Solid-state radars: Replacing magnetron-based systems, these offer 0.5-second updates (vs. 5 minutes) and 60% lower power draw. Spain’s Ebro Observatory has been testing them for hail detection since 2022.
- AI-driven nowcasting: DeepMind’s DGMR reduces false alarms for heavy rain by 89% using generative adversarial networks.
- Distributed sensor grids: Smart cities are embedding weather sensors in streetlights and drones, achieving 100-meter resolution. Berlin’s Urban Climate Observatory uses 1,000+ IoT nodes to map heat islands.
- Quantum NWP: D-Wave and ECMWF are experimenting with quantum annealing to solve Navier-Stokes equations 200x faster—potentially extending accurate forecasts to 3 weeks.
The Next Time You Check the Weather Forecast in a Mobile App…
…remember: map animation is a mosaic of orbiting sensors, teraflop-grade math, and relentless error-correction. In 2023, 3-day weather forecasts reached nearly 90% accuracy, up from 75% in 2000. Are they still imperfect? Definitely. But for those who thrive on continuous improvement, the real excitement isn’t about achieving a “perfect” forecast. It’s about the ongoing challenge of making predictions more precise each year, driven by advancements in technology.


