


Table of Links
Abstract and 1 Introduction
2 Background and 2.1 Blockchain
2.2 Transactions
3 Motivating Example
4 Computing Transaction Processing Times
5 Data Collection and 5.1 Data Sources
5.2 Approach
6 Results
6.1 RQ1: How long does it take to process a transaction in Ethereum?
6.2 RQ2: How accurate are the estimates for transaction processing time provided by Etherscan and EthGasStation?
7 Can a simpler model be derived? A post-hoc study
8 Implications
8.1 How about end-users?
9 Related Work
10 Threats to Validity
11 Conclusion, Disclaimer, and References
A. COMPUTING TRANSACTION PROCESSING TIMES
A.1 Pending timestamp
A.2 Processed timestamp
B. RQ1: GAS PRICE DISTRIBUTION FOR EACH GAS PRICE CATEGORY
B.1 Sensitivity Analysis on Block Lookback
C. RQ2: SUMMARY OF ACCURACY STATISTICS FOR THE PREDICTION MODELS
D. POST-HOC STUDY: SUMMARY OF ACCURACY STATISTICS FOR THE PREDICTION MODELS
5 DATA COLLECTION
In this section, we describe the data sources that we used (Section 5.1) and the data collection steps that we followed (Section 5.2) in order to answer our research questions.
5.1 Data Sources
Our study involves three main data sources: Etherscan, EthGasStation, and Google BigQuery. In the following, we describe these data sources:
Etherscan. Etherscan is a widely used real-time dashboard for the Ethereum blockchain. This website contains information about transactions, blocks, and even the source code for many smart contracts. Most importantly for this paper, Etherscan also tracks pending transactions and provides two transaction processing time predictors: one in the Pending Transactions webpage and another in the Gas Tracker webpage.
EthGasStation. EthGasStation is an online service that provides estimates of transaction processing times for a range of gas prices. The predictions can be obtained from two different endpoints of their web service, which we refer to as the Gas Price API and the Prediction Table API.
Google BigQuery. Google BigQuery is an online platform that is used to analyze large datasets. Google also actively maintains several public datasets, including an Ethereum dataset[5]. This dataset is updated daily and it contains metadata about transactions, blocks, and smart contracts (among others).
5.2 Approach
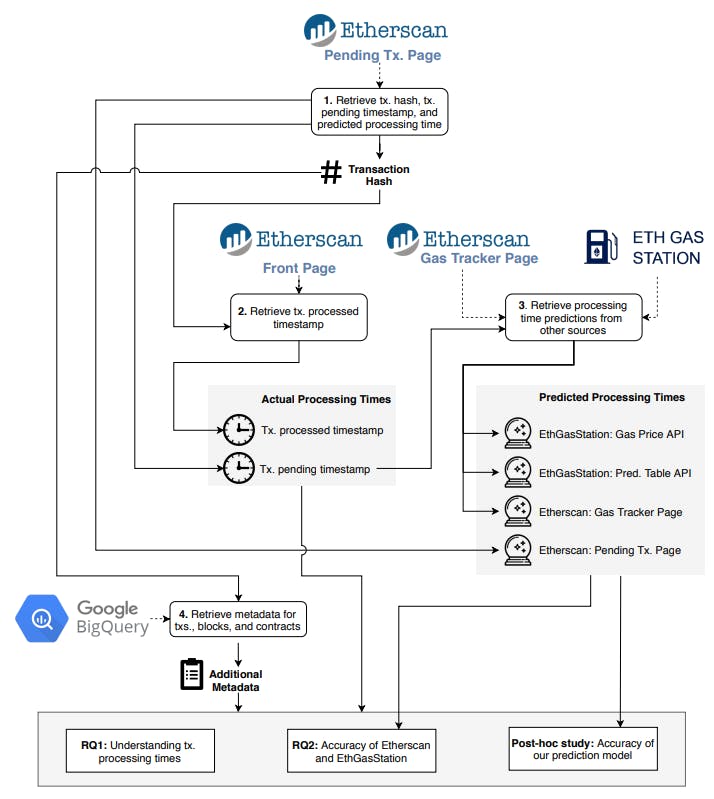
In the following, we discuss the specific pieces of data that we collected to help answer each of our research questions. An overview of our data collection approach is illustrated in Figure 3.
1. Retrieve tx. hash, tx. pending timestamp, and predicted processing time. Every transaction has a unique identifier known as the transaction hash. We collected this hash for all transactions shown in the Pending Transactions webpage of Etherscan during the period of Nov. 21st 2019 until Dec. 09th 2019. In total, we collected 283,102 hashes. These collected hashes represent all the transactions that we studied in this paper. They are used as input to all other data collection steps.
For each transaction in the Pending Transactions webpage, we also collect two pieces of information: the transaction pending timestamp (see Section A.1) and the predicted processing time (see the estimated confirmation duration in Figure 17). Although Etherscan calls it Estimated *Confirmation* Duration, the value actually refers to the estimated processing time (i.e., the shown value does not include any extra time for transaction confirmation/finality). Indeed, hovering the mouse over the question mark symbol to the left of the Estimated Confirmation Duration text reveals a popup with the following message: “An estimate of the duration before the transaction is mined. Time can vary according to the network congestion”.
2. Retrieve tx. processed timestamp. We retrieve the processed timestamp for each studied transaction (see Section A.2). At this point, we are able to compute the actual transaction processing times (i.e., the delta between the pending timestamp and the processed timestamp). The actual processing times are used in our two research questions.


3. Retrieve processing time predictions from other sources. We obtain three additional processing time predictions, which are provided by EthGasStation and Etherscan. We obtain predictions continuously, every 1 minute. We also save the retrieval timestamp, which denotes the instant at which the predictions were retrieved. This retrieval timestamp allows us to relate the predictions to our studied transactions. This is achieved by mapping the pending timestamp of our studied transactions to the closest retrieval timestamp (with retrieval timestamp < pending timestamp). We highlight that these three additional models only provide predictions for a range of specific gas prices at any given time. If there is no exact match between the gas price of a studied transaction and the set of specific gas prices listed by a model, we match the former to the closest price in the latter. In the following, we describe how we obtain the predictions from EthGasStation and Etherscan.
From EthGasStation, we collect predictions from its two API end points: Gas Price[6] and Prediction Table[7]. The information provided by these endpoints is also found on the front page[8] and predict table[9] webpage of EthGasStation respectively. Both of these predictions also limit the users to predictions based on a certain range of gas prices associated with transactions. In RQ2, we evaluate the predictions made for a specific gas price by these two endpoints and determine whether they provide the same results. These two EthGasStation models are open-source, and can be found on multiple Github repositories[10-11]. EthGasStation also includes a Transaction Calculator (Tx Calculator)[12] on their website, which suggests four different gas prices (categorized into cheap, average, fast, and fastest) and predicts the mean processing times for each of them. The four gas prices suggested by the Tx Calculator are identical to those suggested in the Gas Price API Endpoint at the same time of access, as they use the same Poisson model that is fit on transaction data every 100 blocks[13]. However, the corresponding processing time predictions of these two tools are actually different, as the Tx Calculator provides the mean processing time, while the Gas Price API Endpoint provides the exact value resulting from their Poisson model. The Gas Price Endpoint in turn is a more relevant source for comparing the predictions made by our model and EthGasStation’s Poisson model.
Etherscan contains a webpage called Gas Tracker[14]. In this webpage, Etherscan provides a range of gas prices and a prediction of their resulting processing times. The Gas Tracker predictions give users a more general sense of potential processing times, as it limits users to a set of predefined gas prices to analyze. In contrast, the prediction made in the Pending Transactions webpage (step 1) is specific to a given transaction. We highlight that the prediction models underlying the Gas Tracker and the Pending Transactions webpages are proprietary, black boxes. For instance, there is no public online documentation regarding which machine learning algorithm is being used, the features employed by the model, and the model retraining frequency.
The predicted processing times from the 4 different sources are compared to each other in RQ2.
Authors:
(1) MICHAEL PACHECO, Software Analysis and Intelligence Lab (SAIL) at Queen’s University, Canada;
(2) GUSTAVO A. OLIVA, Software Analysis and Intelligence Lab (SAIL) at Queen’s University, Canada;
(3) GOPI KRISHNAN RAJBAHADUR, Centre for Software Excellence at Huawei, Canada;
(4) AHMED E. HASSAN, Software Analysis and Intelligence Lab (SAIL) at Queen’s University, Canada.
[6] https://ethgasstation.info/json/ethgasAPI.json
[7] https://ethgasstation.info/json/predictTable.json
[8] https://ethgasstation.info/
[9] https://ethgasstation.info/predictionTable.php
[10] https://github.com/ethgasstation/ethgasstation-backend
[11] https://github.com/ethgasstation/gasstation-express-oracle
[12] https://legacy.ethgasstation.info/calculatorTxV.php
[13] https://legacy.ethgasstation.info/FAQcalc.php 14https://etherscan.io/gasTracker


