


Table of Links
Abstract and I. Introduction
II. Background and Related Work
A. Learning to Program: SCRATCH and Pair Programming
B. Gender in Programming Education and Pair Programming
III. Course Design
A. Introducing Young Learners to Pair Programming
B. Implementation of Pair Programming
C. Course Schedule
IV. Method
A. Pre-Study and B. Data Collection
C. Dataset and D. Data Analysis
E. Threats to Validity
V. Results
A. RQ1: Attitude
B. RQ2: Behavior
C. RQ3: Code
VI. Conclusions and Future Work, Acknowledgments, and References
V. RESULTS
As part of our experiment procedure, we explicitly refrained from assigning the pairs in order to not bias the students and to provide a realistic classroom setting. Since the resulting number of mixed pairs is proportionally very low (n=3), it is unlikely to provide representative and statistically significant results, and we therefore focus on both same-sex pairs in the analysis, and only mention specifics of the mixed pairs in the discussion where they provide relevant insights. Clearly, one lesson learned in this context is that, for better or for worse, students in this age group prefer to work with the same sex.
A. RQ1: Attitude
To determine the students’ attitude towards programming and their roles, we consider the coolness factor, fun factor, rankings of difficulty and enjoyment, and evaluation of roles.
1) Attitude Towards Programming: Since a positive attitude towards programming is essential and girls often have a negative one [37], [39], we determine the students’ attitude towards programming from the start to the end of the course (Figure 3). We observe a significant change for both same-sex pairs (both p < 0.001). Overall, an increase towards a positive attitude exists for both types of pairs, although the increase is largest for the all-female pairs (Figure 3). Thus, it seems that our course design, in addition to the self-experience, contributes to avoid stereotypical preferences and thus, enables especially girls to change their mindset towards programming [37].
2) Attitude Towards Course Tasks: Considering the results of the Fun Toolkit (Table II), all students liked the tasks and would do them again, and there are only minor differences between the all-female and all-male pairs. Thus, the design and implementation of the tasks seem well suited for this age group and universally applicable. We assume that potential differences arising in our analysis are thus more likely due to PP behavior rather than gender biases regarding the task.
Figure 4 shows the students’ ranking of the tasks they liked best or least, and found easiest or most difficult (percentage of colored stickers, cf. Section IV-D1). The rankings of fun and difficulty differ between the pairs, although not significantly. While all-female pairs considered the first task to be the most


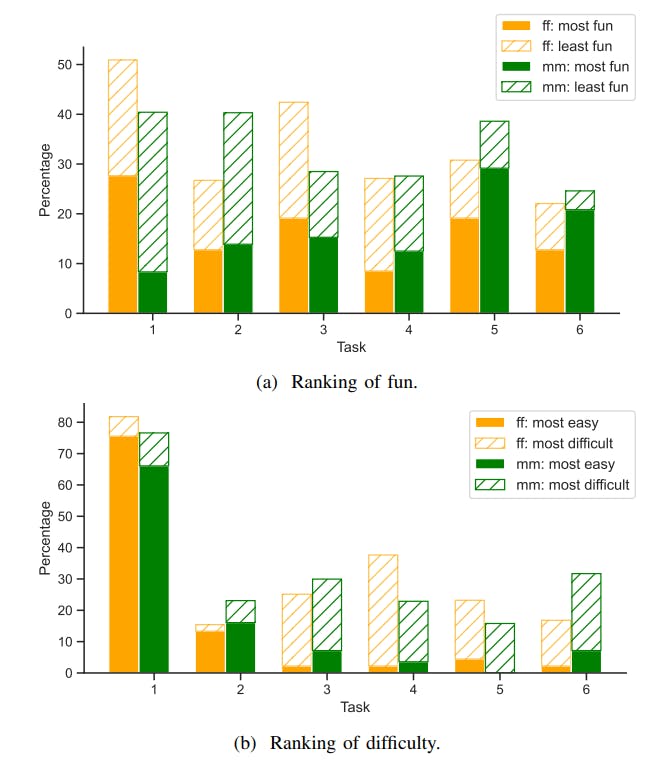


enjoyable, for the all-males the fifth task was by far the best, and over one-third of the boys found the first task the least fun. This is intriguing, since both same-sex pairs agree that task one was the easiest by far. Thus, girls seem to like the simplicity or the playful and creative aspect of this task [16], [44], which makes it a suitable introductory task to lower the girls’ initial hurdle, while boys seem to enjoy such kind of tasks less and may need an additional task, which results in a balancing act between having sufficient freedom for creativity versus solving a challenge [53].
While the all-female pairs experienced the fourth task as the most difficult by far, the all-male pairs found the last task the most challenging (Figure 4). The fourth task focused on the self-directed implementation of loops and conditionals, and the last task was the second free creative activity—so both same-sex pairs may have felt overwhelmed by these tasks due to their autonomy and demand for adaption [54]. In particular, since the fifth task was also a free task, which is also the most popular among the young boys (Figure 4), the question emerges as to why task 6 is perceived as more difficult by the boys. We conjecture that the boys either expanded their projects creatively during the fifth task to such an extent that (1) they could not think of anything else to do and therefore found it tough or “boring”, or (2) “destroyed” the project more during task 5, thus inhibiting task 6. However, both same-sex pairs considered the third task to be the second most difficult, with about 23 % each (Figure 4). Thus, the introduction of conditionals seems to be universally challenging [46], [48].
3) Attitude Towards PP Roles: To determine which PP roles the students enjoyed the most, we consider how much the pairs liked their assigned roles (Table III). Overall, students in all pairs found the role of the driver to be significantly better than that of the navigator (ff: p = 0.011, fm: p = 0.015, mm: p = 0.028) (Table III). The boys disliked the navigator role the most in the first task, suggesting they probably also wanted to take the lead here. However, the all-female pairs preferred the navigator slightly from the fourth task to the last. This suggests that the girls prefer not to be in charge of controlling the computer the more self-reliant the task becomes. Compared across tasks, all-female pairs were most comfortable with either role in the last task, and the boys similarly stated to like both roles the most in the last two tasks, which is likely because they had become familiar to the roles [43].
Comparing the pairs shows that mixed pairs enjoy the role of the navigator significantly less across all tasks than both same-sex pairs (∅ 0.47, both p < 0.001). We observe one single statistically significant difference for the driver between the two same-sex pairs in task five, where the all-male pairs enjoyed the task more than the all-female pairs (p = 0.037).


