


Table of Links
Abstract/Zusammenfassung
Publications
Acknowledgements
CHAPTER 1: INTRODUCTION
-
Introduction
1.1 Overview of thesis contributions
1.2 Thesis outline
CHAPTER 2: BACKGROUND
2.1 Blockchains & smart contracts
2.2 Transaction prioritization norms
2.3 Transaction prioritization and contention transparency
2.4 Decentralized governance
2.5 Blockchain Scalability with Layer 2.0 Solutions
CHAPTER 3. TRANSACTION PRIORITIZATION NORMS
-
Transaction Prioritization Norms
3.1 Methodology
3.2 Analyzing norm adherence
3.3 Investigating norm violations
3.4 Dark-fee transactions
3.5 Concluding remarks
CHAPTER 4. TRANSACTION PRIORITIZATION AND CONTENTION TRANSPARENCY
-
Transaction Prioritization and Contention Transparency
4.1 Methodology
4.2 On contention transparency
4.3 On prioritization transparency
4.4 Concluding remarks
CHAPTER 5. DECENTRALIZED GOVERNANCE
-
Decentralized Governance
5.1 Methodology
5.2 Attacks on governance
5.3 Compound’s governance
5.4 Concluding remarks
CHAPTER 6. RELATED WORK
6.1 Transaction prioritization norms
6.2 Transaction prioritization and contention transparency
6.3 Decentralized governance
CHAPTER 7. DISCUSSION, LIMITATIONS & FUTURE WORK
7.1 Transaction ordering
7.2 Transaction transparency
7.3 Voting power distribution to amend smart contracts
Conclusion
Appendices
APPENDIX A: Additional Analysis of Transactions Prioritization Norms
APPENDIX B: Additional analysis of transactions prioritization and contention transparency
APPENDIX C: Additional Analysis of Distribution of Voting Power
Bibliography
APPENDIX B: Additional analysis of transactions prioritization and contention transparency
B.1 Ethereum private transaction experiment
We conducted 4 active experiments where we issued 8 Ethereum transactions; half issued publicly and the other half privately through a private-channel network known as Taichi Network (SparkPool, 2021). Table B.1 summarizes the transactions in our experiment. Spark Pool and Babel Pool included all private transactions (2 transactions each) sent directly to these miners through Taichi Network.
B.2 Liquidation with Chainlink oracle updates
In AAVE, of 1154 bundles, 994 (86.14%) include one Chainlink oracle update followed by a liquidation. There are 52 (4.51%) with two oracle updates followed by liquidations. Out of 1301 oracle updates bundled with liquidations, 282 (21.68%) are USDC-ETH, 203 (15.60%) are USDT-ETH, 169 (12.99%) are DAI-ETH, 70 (5.38%) are SUSD-ETH, and 60 (4.61%) are LINK-ETH. In Compound, of 641 bundles, 548 (85.49%) contain one Chainlink oracle update followed by one liquidation, while 39 (6.08%) include two oracle updates followed by liquidations. Out of 751 oracle updates bundled with liquidations, 311 (41.41%) are ETH-USD, 128 (17.04%) are BTC-USD, and 53 (7.06%) are UNI-USD.

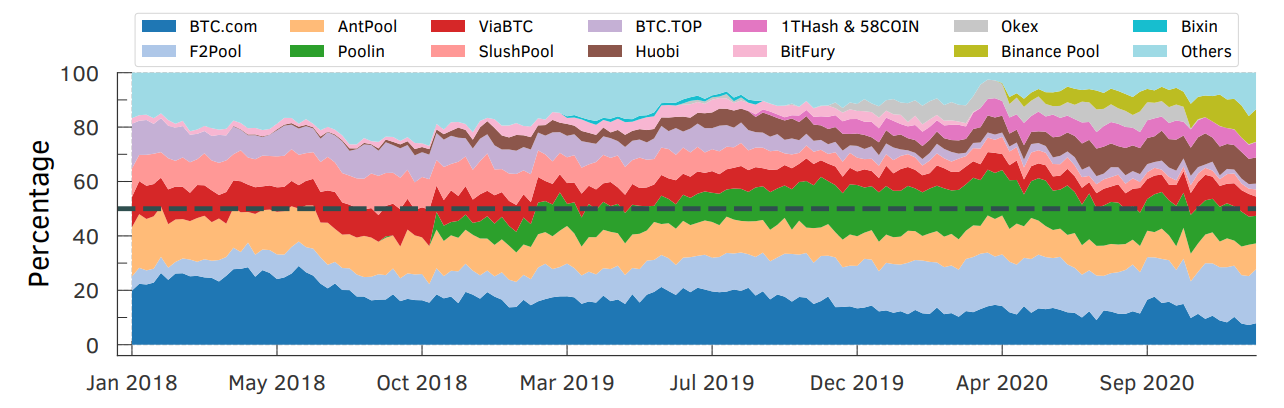
B.3 Hashing rates of mining pools
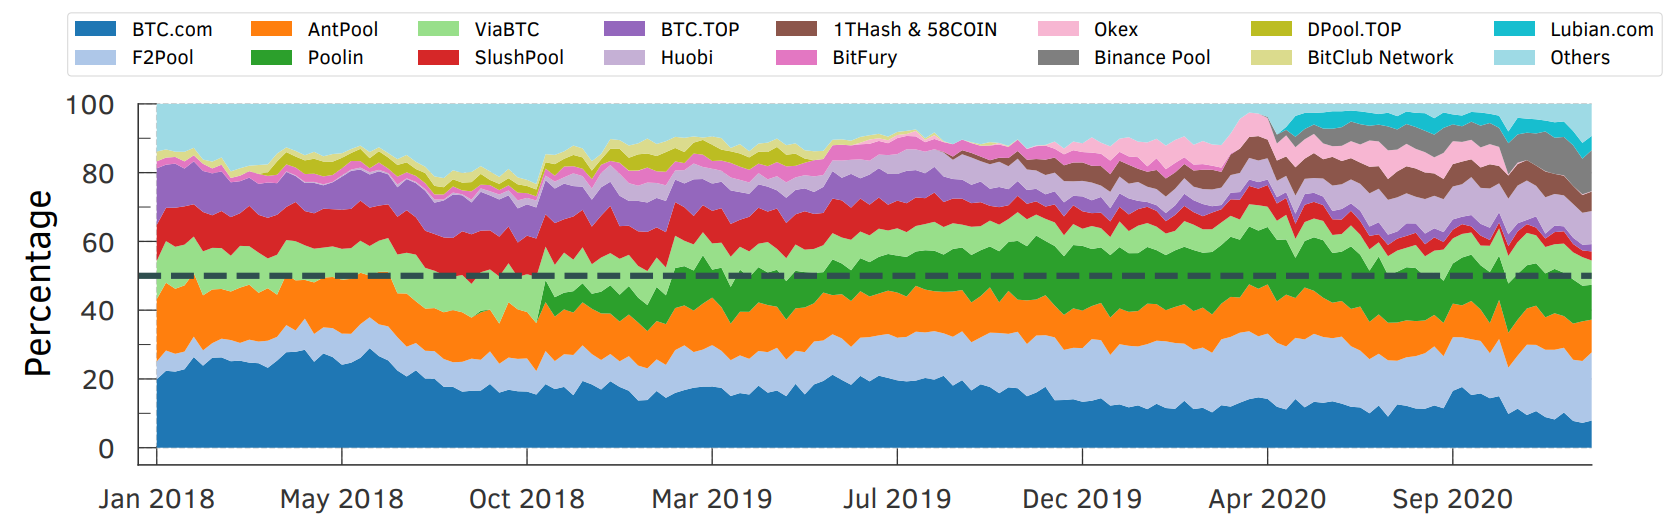
Per Figure B.1, the hash rates of Bitcoin mining pools such as BTC.com, F2Pool, and AntPool alone accounted for almost half the total hash rate of the network around May 2018, and roughly a year later, i.e., from March 2019, together with Poolin the four mining pools alone represent more than 50% of the total network hash rate. At the end of 2020, new MPOs, e.g., Lubian.com and Binance Pool, started mining Bitcoin, which help improve the decentralization of Bitcoin. However, BTC.com, F2Pool, AntPool, and Poolin still account for almost half of the hash rates showing that a few mining pools control a considerable portion of the Bitcoin hash rate.
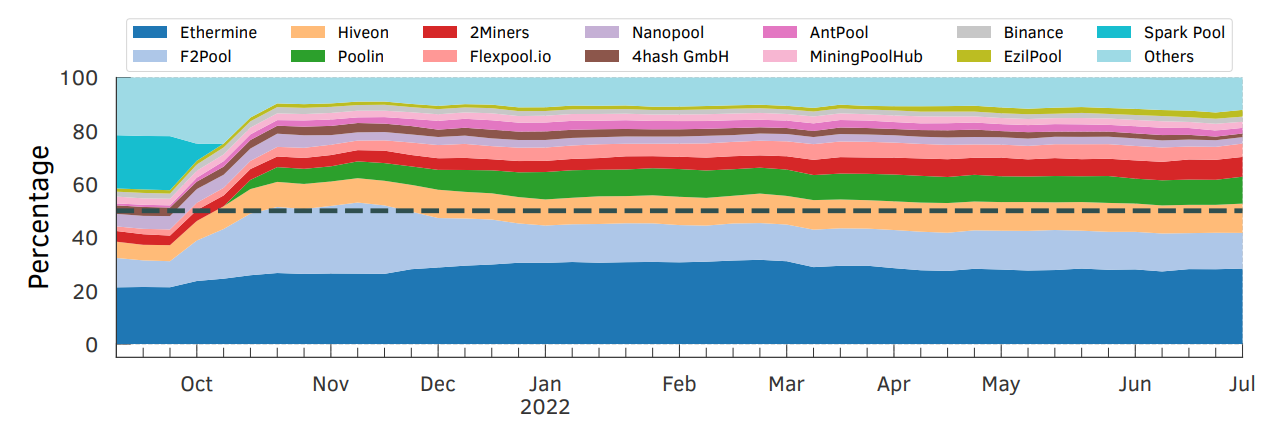
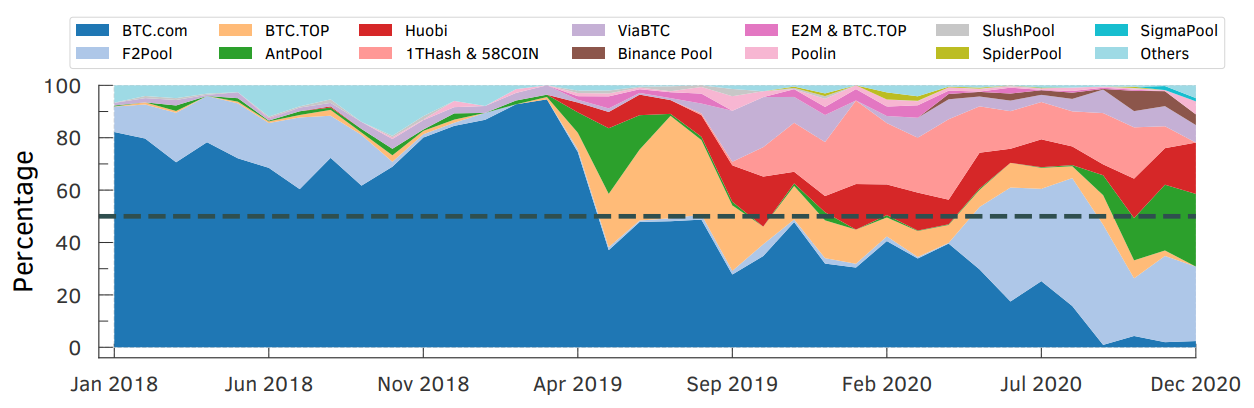
Hash rates of Ethereum mining pools, in contrast to Bitcoin, do not show a high variance (see Figure B.2). We also observed that Spark Pool, the second-largest Ethereum mining pool, suspended their mining services on September 30, 2021, due to regulatory requirements in response to Chinese authorities (Helen Partz, 2021).


B.4 Bitcoin transaction acceleration experiment
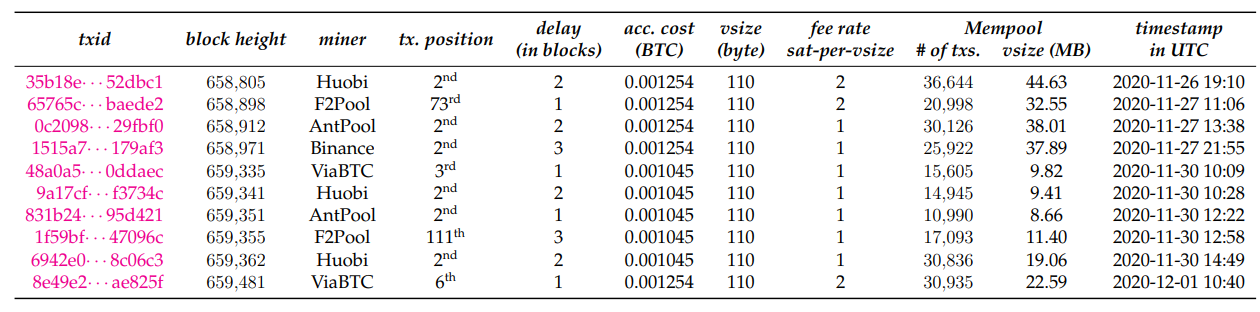
We ran an active Bitcoin transaction acceleration experiment where we paid 205 EUR to ViaBTC (ViaBTC, 2022) to accelerated 10 transactions from 10 different snapshots of our Mempool. To select these transactions, we checked whether the Mempool was congested (i.e., having more transactions waiting for inclusion than the next block would be able to include), with its size being at least 8 MB. Then, we considered only transactions with low fee rates—less than or equal to 2 sat-per-byte—to ensure that these transactions would be highly unlikely to be included soon in a subsequent block. Next, we sorted the remaining transactions by size to limit the experiment cost as the acceleration-service costs grow proportional to the transaction size. Finally, we select the transaction with the smallest size in bytes for our active experiment.
Most of these 10 accelerated transactions were included nearly in the next block, demonstrating the acceleration efficiency. Also, these transactions were wrongly positioned in the block: They appeared, for instance, at the top of the block, i.e., higher

than the non-accelerated transactions, showing that miners indeed prioritized them (see Table 4.3). Further, we observed that although we had only accelerated transactions via ViaBTC, other top mining pools were also involved in confirming the accelerated transactions.
Table B.2 shows the transactions used in our experiments. At the time we conducted our experiments, if we rank the miners whose included these transactions based on their daily hash-rate power as (D) and weekly hash-rate power as (W), we would have Huobi (D: 8.1%; W: 9.3%), Binance (D: 9.6%; W: 10.3%), F2Pool (D: 19.9%; W: 18.7%), AntPool (D: 12.5%; W: 10.6%), ViaBTC (D: 5.1%; W: 7.1%). Together these mining pools corresponds to a hash-rate power of (D: 55.2%; W: 56%). Figures B.3 and B.4 show the hash-rate of mining pools in the active experiment and considering the passive experiment (inferred to be accelerated by BTC.com API), respectively.
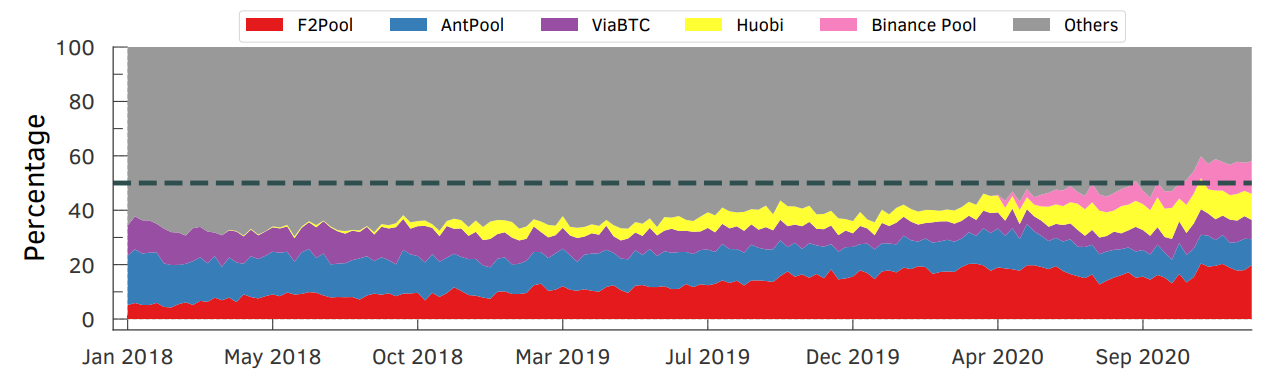
Furthermore, BTC.com (BTC.com, 2022), one of the leading Bitcoin mining pools, provides transaction acceleration services and allows users to verify if transactions have been accelerated through their platform or partner services. From our dataset, we selected those with a SPPE greater than or equal to 1% (12,983,282 transactions in total) and checked if they were said to be accelerated by BTC.com’s API. Of these transactions, 14,104 were found to have been accelerated. Our findings also show that transaction acceleration services are becoming quite common among Bitcoin mining pools (as shown in Figure B.5). Between 2018 and April 2019, only BTC.com and F2Pool alone accounted for most of the accelerated transactions. However, as of December 2020, we see that BTC.com accounts for a very small fraction of accelerated transactions, with AntPool, Huobi, and F2Pool accounting for most of the accelerated transactions.


:::info
Author:
(1) Johnnatan Messias Peixoto Afonso
:::
:::info
This paper is available on arxiv under CC BY 4.0 DEED license.
:::


