


Table of Links
Abstract and I. Introduction
-
Materials and Methods
2.1. Multiple Instance Learning
2.2. Model Architectures
-
Results
3.1. Training Methods
3.2. Datasets
3.3. WSI Preprocessing Pipeline
3.4. Classification and RoI Detection Results
-
Discussion
4.1. Tumor Detection Task
4.2. Gene Mutation Detection Task
-
Conclusions
-
Acknowledgements
-
Author Declaration and References
4.2. Gene Mutation Detection Task
For the magnification level 5x, the models’ performance was poor (Table2). The AMIL model showed the best performance, with an average AUC of 0.605. The hypothesis that was already supported by the results in previous work [24] is still supported here: tiles at 5x magnification, a level at which only tissue is visible, cannot show discernible evidence of TP53 mutations for most cases. Therefore, regarding the model’s ability to identify mutations for this gene, it is not possible to draw conclusions from this magnification level.
At level 10x, we obtained far better AUC results (Table2). The AMIL model still shows the best performance in terms of its average AUC (0.711), but the AdMIL model also presents a reasonable score (0.624). Our version of AdMIL, however, did not improve considerably for most runs, with an average score of 0.547.
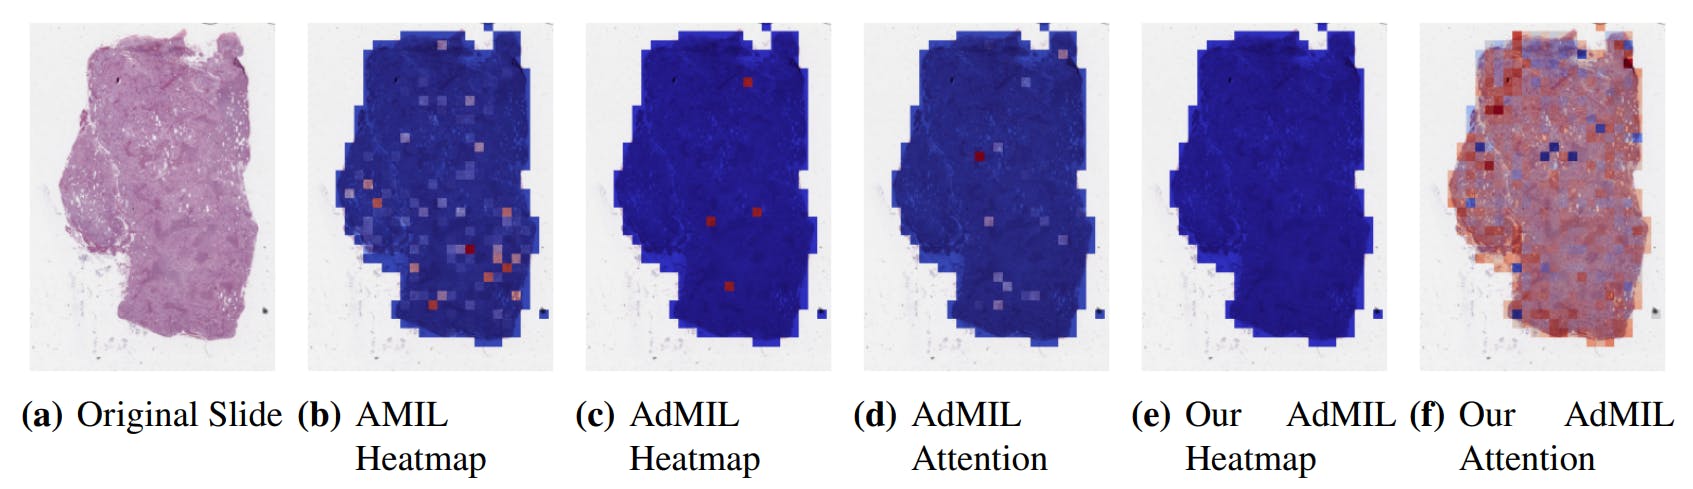
For this task, at this level, the number of patches highlighted in heatmaps is far scarcer. In the case of the AMIL model, unlike the previous task, the attention mechanism focused more on the inner patches (Figure 8(b)). This could be due to the fact that it is looking for a different pattern in the morphology that might not be present in the borders, but it is also true that, at these magnification levels, the number of patches with background is more scarce, unlike the previous task.
The original AdMIL model focused on a very short number of patches (Figure 8(c)). Even though it classifies slides as showing signs of TP53 mutation, at this magnification level, it does not seem to be able to point to relevant regions, only highlighting individual patches that are distant and isolated from each other. Just like in the tumor detection task, its attention mechanism only focused on a small number of patches (Figure 8(d)).
Our version of AdMIL, on the other hand, is unable to identify any excitatory patches from the majority of WSI (Figure 8(e)). This might have to do with the fact that its attention mechanism is not able to make a notable distinction between patches, attributing very similar attention scores to all of them (Figure 8(f)). This also explains the low average AUC obtained by this model at this magnification level.
At level 20x, the results did not change by much for AMIL and AdMIL, but improved a lot for our modified version of AdMIL, with an AUC score of 0.642. For this level, the heatmaps produced also did not show much change from the ones at magnification 10x. However, it is interesting to notice that the attention scores produced by our version of AdMIL, unlike the previous level, focused around a specific region on the WSI (Figure 9(f)). However, this model continues to produce only inhibitory scores.
The AUC scores obtained by our models for levels 10x and 20x are comparable with the ones obtained by previous work [4, 17], although we have used simpler architectures. However, this comparison should be taken carefully, since the models were trained on different datasets (with different methods for tile preprocessing) and often for a different type of gene mutation.
In general, the quantitative results for this task are not as good as those from the tumor detection task. The heatmaps produced do not seem to highlight a significant number of patches. This might be because signs of TP53 mutation might appear more isolated in these slides. Just like for the previous task, further evaluation of the heatmaps by specialists would have to be done to reach a definite conclusion.
We speculate that the models’ ability to learn patterns related to the TP53 mutation might have been affected by the dataset used. Although we only used FFPE slides, which are typically better for WSI computational analysis, the fact that, due to time constraints, our WSI bags were built using random sampling might have reduced the quality of their representation of the slide. Furthermore, we assumed that all slides belonging to a positive patient are positive as well. All these factors might have introduced too much noise to the dataset.
Beside the possibility of too much noise, we come to the conclusion that detecting patterns of TP53 mutation on digital slides with MIL and attention mechanisms is a much more challenging task, and the results are not as good as when detecting the presence of tumors.
Authors:
(1) Martim Afonso, Instituto Superior Técnico, Universidade de Lisboa, Av. Rovisco Pais, Lisbon, 1049-001, Portugal;
(2) Praphulla M.S. Bhawsar, Division of Cancer Epidemiology and Genetics, National Cancer Institute, National Institutes of Health, Bethesda, 20850, Maryland, USA;
(3) Monjoy Saha, Division of Cancer Epidemiology and Genetics, National Cancer Institute, National Institutes of Health, Bethesda, 20850, Maryland, USA;
(4) Jonas S. Almeida, Division of Cancer Epidemiology and Genetics, National Cancer Institute, National Institutes of Health, Bethesda, 20850, Maryland, USA;
(5) Arlindo L. Oliveira, Instituto Superior Técnico, Universidade de Lisboa, Av. Rovisco Pais, Lisbon, 1049-001, Portugal and INESC-ID, R. Alves Redol 9, Lisbon, 1000-029, Portugal.
This paper is available on arxiv under CC by 4.0 Deed (Attribution 4.0 International) license.


