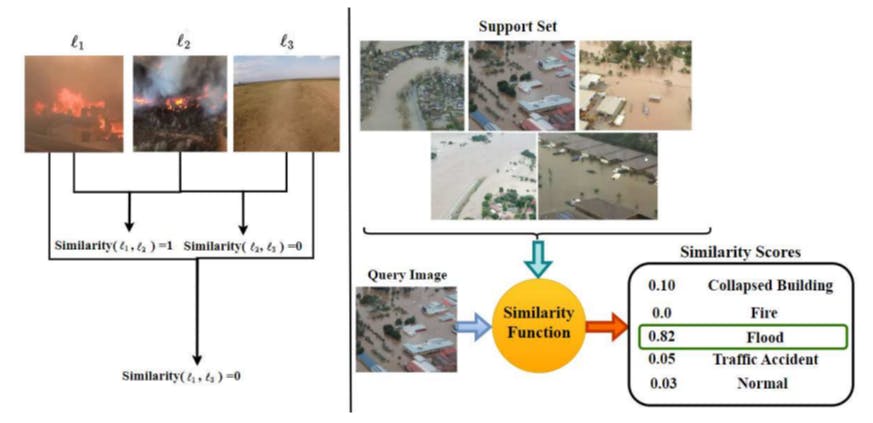
Before delving into the various approaches in a few-shot remote sensing task, we highlight in this section some evaluation metrics that are more suited for few-shot learning task. The data distribution would display some degree of imbalance between the training set and the test set for small-sample size unlike typical learning-based tasks, and hence appropriate metrics addressing such imbalance would need to be invoked. We illustrate in Table 1 the various metrics along with a brief overview. The metrics are the confusion matrix, precision, recall, F1 score, Overall Accuracy (OA), Average Accuracy (AA), Kappa coefficient κ, and PR curve. (5)-(9) mathematically describe some of the metrics as indicated in the respective equations.
The variables T P, F P, T N, and F N in the previous equations represent true positive, false positive, true negative, and false negative classes, respectively. In equation (6), Nclasses refers to the total number of classes that are taken into consideration.
Authors:
(1) Gao Yu Lee, School of Electrical and Electronic Engineering, Nanyang Technological University, 50 Nanyang Ave, 639798, Singapore ([email protected]);
(2) Tanmoy Dam, School of Mechanical and Aerospace Engineering, Nanyang Technological University, 65 Nanyang Drive, 637460, Singapore and Department of Computer Science, The University of New Orleans, New Orleans, 2000 Lakeshore Drive, LA 70148, USA ([email protected]);
(3) Md Meftahul Ferdaus, School of Electrical and Electronic Engineering, Nanyang Technological University, 50 Nanyang Ave, 639798, Singapore ([email protected]);
(4) Daniel Puiu Poenar, School of Electrical and Electronic Engineering, Nanyang Technological University, 50 Nanyang Ave, 639798, Singapore ([email protected]);
(5) Vu N. Duong, School of Mechanical and Aerospace Engineering, Nanyang Technological University, 65 Nanyang Drive, 637460, Singapore ([email protected]).


