Table of Links
Abstract and 1. Introduction
2. Preliminaries and 2.1. Blind deconvolution
2.2. Quadratic neural networks
3. Methodology
3.1. Time domain quadratic convolutional filter
3.2. Superiority of cyclic features extraction by QCNN
3.3. Frequency domain linear filter with envelope spectrum objective function
3.4. Integral optimization with uncertainty-aware weighing scheme
4. Computational experiments
4.1. Experimental configurations
4.2. Case study 1: PU dataset
4.3. Case study 2: JNU dataset
4.4. Case study 3: HIT dataset
5. Computational experiments
5.1. Comparison of BD methods
5.2. Classification results on various noise conditions
5.3. Employing ClassBD to deep learning classifiers
5.4. Employing ClassBD to machine learning classifiers
5.5. Feature extraction ability of quadratic and conventional networks
5.6. Comparison of ClassBD filters
6. Conclusions
Appendix and References
4.4.1. Dataset description
4.4.1. Dataset description
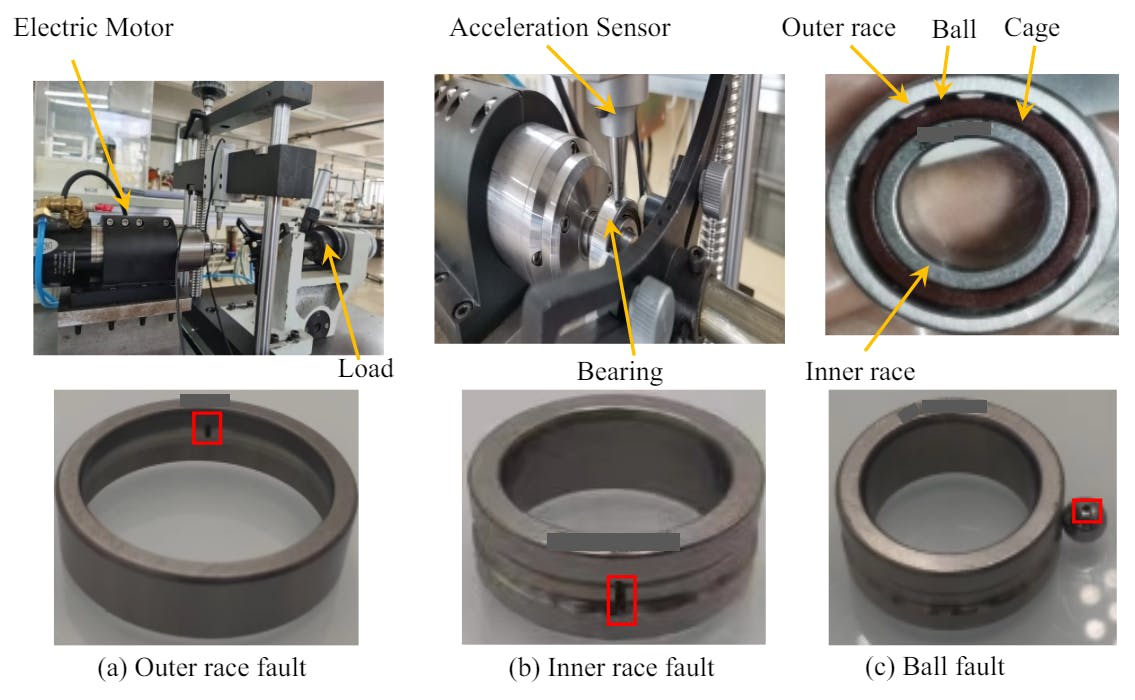
The Harbin Institute of Technology (HIT) dataset was collected by our team. The data acquisition for faulty bearings was conducted at the MIIT Key Laboratory of Aerospace Bearing Technology and Equipment at HIT. The bearing test rig and faulty bearings are illustrated in Figure 4. This test rig follows the Chinese standard rolling bearing measuring method (GB/T 32333-2015). The test bearings used were HC7003 angular contact ball bearings, typically employed in high-speed rotating machines. For signal collection, an acceleration sensor was directly attached to the bearing, and the NI USB-6002 device was used at a sampling rate of 12 KHz. Approximately 47 seconds of data were recorded for each bearing, resulting in 561,152 data points per class. The rotation speed was set to 1800rpm, significantly faster than previous datasets.
Moreover, defects were manually injected at the outer race (OR), inner race (IR), and ball, similar to the JNU dataset. However, we established three severity levels (minor, moderate, severe), resulting in ten classes, as detailed in Table 6. This dataset presents a greater challenge than the JNU dataset due to the faults being cracks of the same size but varying depths, leading to more similarity in the features of different categories.
The segmentation of the dataset is similar to that of the JNU dataset. A stride of 28 was set to acquire a larger volume of data. The last quarter of the data was designated as the test set, while the remaining data were randomly divided into training and validation sets at a ratio of 0.8:0.2. Consequently, the training set, validation set, and test set comprise 113920, 28480, and 46732 samples, respectively. Lastly, the SNR levels were set at -10dB, -8dB, -6dB, -4dB.
4.4.2. Classification results
The classification results are presented in Table 7. Several observations observations are as follows. Firstly, ClassBD outperforms its competitors in terms of both F1 score and FPR across all noise conditions. The F1 score of ClassBD exceeds 96%, compared to the second-best method, EWSNet, which achieves an average F1 score of 92.75%. Secondly, it is noteworthy that even under severe noise conditions (-10dB), ClassBD maintains an F1 score of 93%, indicating its robust anti-noise performance. Under these conditions, the performance of all other methods, except EWSNet, degrades significantly. This phenomenon highlights the superiority of ClassBD.
Furthermore, we reduce the dimensions of the last layer features of all methods to 2D space using t-SNE [81] under -10dB noise. The results are depicted in Figure 5. Overall, the features of the five methods can generate distinct clusters, with the exception of TFN, which aligns with their categorical performance. However, all methods exhibit some degree of misclassification. For instance, the red points (OR3) of DRSN and EWSNet appear within the blue clusters (B3), indicating that some instances of OR3 are misclassified as B3. Similarly, in GTFENet and WaveleKernelNet, some green points (IR3) overlap with the IR2 and B3 clusters. In contrast, ClassBD only has a few outliers that are misclassified into other clusters, demonstrating its superior feature extraction ability under high noise conditions.
In summary, based on the performance across three datasets, we illustrate the average F1 scores of all methods in Figure 6. The results indicate that our method, ClassBD, outperforms other baseline methods on all datasets, with average F1 scores exceeding 90%. This underscores the robust anti-noise performance of ClassBD.
Authors:
(1) Jing-Xiao Liao, Department of Industrial and Systems Engineering, The Hong Kong Polytechnic University, Hong Kong, Special Administrative Region of China and School of Instrumentation Science and Engineering, Harbin Institute of Technology, Harbin, China;
(2) Chao He, School of Mechanical, Electronic and Control Engineering, Beijing Jiaotong University, Beijing, China;
(3) Jipu Li, Department of Industrial and Systems Engineering, The Hong Kong Polytechnic University, Hong Kong, Special Administrative Region of China;
(4) Jinwei Sun, School of Instrumentation Science and Engineering, Harbin Institute of Technology, Harbin, China;
(5) Shiping Zhang (Corresponding author), School of Instrumentation Science and Engineering, Harbin Institute of Technology, Harbin, China;
(6) Xiaoge Zhang (Corresponding author), Department of Industrial and Systems Engineering, The Hong Kong Polytechnic University, Hong Kong, Special Administrative Region of China.
This paper is available on arxiv under CC by 4.0 Deed (Attribution 4.0 International) license.


