Table of Links
Abstract and 1 Introduction
2 Related Work
3 Methodology
4 Studying Deep Ocean Ecosystem and 4.1 Deep Ocean Research Goals
4.2 Workflow and Data
4.3 Design Challenges and User Tasks
5 The DeepSea System
- 5.1 Map View
- 5.2 Core View
5.3 Interpolation View and 5.4 Implementation
6 Usage Scenarios and 6.1 Scenario: Pre-Cruise Planning
- 6.2 Scenario: On-the-Fly Decision-Making
7 Evaluation and 7.1 Cruise Deployment
7.2 Expert Interviews
7.3 Limitations
7.4 Lessons Learned
8 Conclusions and Future Work, Acknowledgments, and References
4.2 Workflow and Data
To quantify the distribution of microbial activity in deep sea sediments, microbial ecologists, geochemists and geologists first collect biological and geological samples (often sediment, rock or pore water) from the deep ocean. These samples are then used to examine the geochemical, sedimentological, and biological characteristics of the environment. The sampled cores and associated parameters are
both sparse and multidimensional (i.e., cores with a fixed location in 3D, sampled at time points ranging from days to decades).
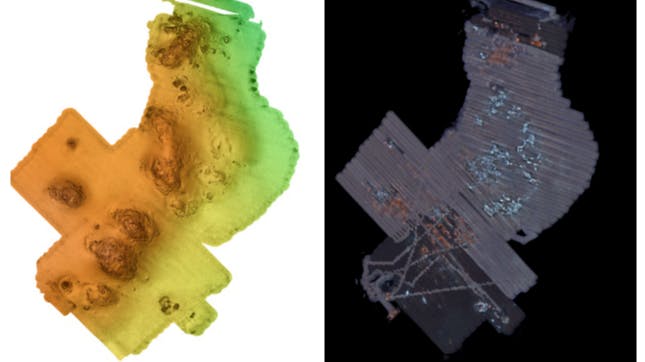
Collecting samples begins with an oceanographic research expedition, where scientists use various human- or robot-operated tools to map the study area and execute sampling dives. For the examples presented in this paper, AUVs (Autonomous Underwater Vehicles) equipped with multibeam sonar collected 1 m lateral resolution bathymetry and acoustic backscatter covering an ≈ 30 km2 area including multiple hydrothermal vent fields. With this context mapping completed, a Low Altitude Survey System (LASS) fielded on an ROV (Remotely Operated Vehicle) then mapped one vent field at much higher resolution, yielding 5 cm resolution bathymetry from a multibeam sonar (Fig. 2A), 1 cm resolution bathymetry from LIDAR, and 5 cm photomosaics from a color stereo camera rig (Fig. 2B) [37]. With these maps, scientists then planned the exploration and execution of sampling dives with ROVs or HOVs (Human Occupied Vehicles) to collect sediment samples from the ocean floor and bring them back to the ship for downstream processing. The samples DeepSee currently visualizes are sediment push cores (PC), hollow polycarbonate tubes 7 cm diameter and 30 cm tall, usually
sectioned shipboard into 1 cm or 3 cm tall horizons. There are two types of data attributes: (1) core-level (Table 1, left) and sample-level (Table 1, right). For core-level analysis, there can be more than a dozen separate measurements conducted for a single horizon with a core; considering a core can have between 7-12 horizons, there are over 84 identification data points to interpret per core. For sample-level analysis, each horizon is processed for a wide variety of geochemical parameters, including sulfide, sulfate, iron, and other chemicals associated with metabolism or the state of the environment. Each horizon is also preserved and sequenced for a quantitative measure of how many microbial community members (taxa, e.g., ANME archaea or sulfate-reducing Desulfobacterota) live there. This typically results in over 500 discrete taxonomic, geochemical, or physical parameters per core, used to identify spatial trends in distributions (Sect. 4.3). Finally, cores are often collected in pairs or clusters for different experiments and assigned a core fate descriptor, e.g., “Geochem” or “Live”, which differentiates what type of metadata and parameters are associated with the core. In DeepSee, these data were stratified into three hierarchical levels and visualized in different ways:
Region-level data. Region-level data (Fig. 2) are predominantly map-format, including low-altitude survey system (LASS) multi beam amplitude and bathymetry (5 cm) [31], AUV bathymetry (1 m lateral resolution), photo mosaics (5 cm resolution), and LIDAR bathymetry (2 cm). Together, these data types reveal the geological landscape (bathymetry) and surface biological and ephemeral “soft” features (photo mosaics and high-resolution LIDAR).
Core-level data. Core-level data (Table 1, left) are unique x,y points within a methane seep where subsurface sediments were sampled. Cores comprise a minimum of 11 parameters stored in a CSV file, including core IDs (e.g., dive number, core number, GPS location), measurements (e.g., temperature, sulfate, sulfide), and associated data (e.g., core type, habitat description).
Sample-level data. Sample-level data (Table 1, right) is typically parameters subdivided within cores into horizons of 2-3 cm each. DeepSee treats each horizon (row) as a sample belonging to a core within a seep. Recent cruises have returned cores with up to 257 depth horizons described in CSV format by 21 physicochemical parameters (e.g. pH), 12 geochemical measurements (e.g. methane concentration), and over 500 biological parameters (microbial identity and abundances).
[3] The example data is provided by Speth et al. [45].
Authors:
(1) Adam Coscia, Georgia Institute of Technology, Atlanta, Georgia, USA ([email protected]);
(2) Haley M. Sapers, Division of Geological and Planetary Sciences, California Institute of Technology, Pasadena, California, USA ([email protected]);
(3) Noah Deutsch, Harvard University Cambridge, Massachusetts, USA ([email protected]);
(4) Malika Khurana, The New York Times Company, New York, New York, USA ([email protected]);
(5) John S. Magyar, Division of Geological and Planetary Sciences, California Institute of Technology Pasadena, California, USA ([email protected]);
(6) Sergio A. Parra, Division of Geological and Planetary Sciences, California Institute of Technology Pasadena, California, USA ([email protected]);
(7) Daniel R. Utter, [email protected] Division of Geological and Planetary Sciences, California Institute of Technology Pasadena, California, USA ([email protected]);
(8) John S. Magyar, Division of Geological and Planetary Sciences, California Institute of Technology Pasadena, California, USA ([email protected]);
(9) David W. Caress, Monterey Bay Aquarium Research Institute, Moss Landing, California, USA ([email protected]);
(10) Eric J. Martin Jennifer B. Paduan Monterey Bay Aquarium Research Institute, Moss Landing, California, USA ([email protected]);
(11) Jennifer B. Paduan, Monterey Bay Aquarium Research Institute, Moss Landing, California, USA ([email protected]);
(12) Maggie Hendrie, ArtCenter College of Design, Pasadena, California, USA ([email protected]);
(13) Santiago Lombeyda, California Institute of Technology, Pasadena, California, USA ([email protected]);
(14) Hillary Mushkin, California Institute of Technology, Pasadena, California, USA ([email protected]);
(15) Alex Endert, Georgia Institute of Technology, Atlanta, Georgia, USA ([email protected]);
(16) Scott Davidoff, Jet Propulsion Laboratory, California Institute of Technology, Pasadena, California, USA ([email protected]);
(17) Victoria J. Orphan, Division of Geological and Planetary Sciences, California Institute of Technology, Pasadena, California, USA ([email protected]).

![Figure 2: Region-level data represented as maps, provided by [37]. Maps reveal two important features: (A) geological landscapes, such as locations of hydrothermal vent mounds and chimneys, visualized by topography from AUV and lowaltitude survey system (LASS) multibeam surveys; and (B) surface biological and ephemeral “soft” features, such as white patches of microbial mats growing in hydrothermal fluids, visualized by photomosaics, acoustic backscatter and LIDAR bathymetry. DeepSee solves a critical challenge of combining region-, core-, and sample-level data in a single interface using expressive and interactive visualizations (Sect. 5).](https://hackernoon.imgix.net/images/fWZa4tUiBGemnqQfBGgCPf9594N2-7s8300i.png?auto=format&fit=max&w=1920)
![Table 1: A Subset of Core-Level and Sample-Level Data Visualized by DeepSee[3]](https://hackernoon.imgix.net/images/fWZa4tUiBGemnqQfBGgCPf9594N2-w493073.png?auto=format&fit=max&w=3840)


