2. Instagram usage statistics
- Instagram usage remains significant, with users highly engaged on the platform. On average, users spend about 33.9 minutes per day on Instagram, reflecting its major role in daily social media activity.
- The platform is particularly popular for visual content, with 500 million daily active users engaging with Instagram Stories.
- Monthly, users spend an average of 12 hours on Instagram, indicating strong user retention and interaction.
- Additionally, 90% of users follow at least one business account, showcasing the platform’s importance for brand engagement.
- Instagram is also the 5th most visited website globally, highlighting its widespread popularity.
3. Instagram engagement statistics
- Engagement on Instagram is notably high, driven by its visual and interactive content. Posts on Instagram have an average engagement rate of 1.89%.
- Instagram Reels, introduced as a competitor to TikTok, have seen tremendous success, generating twice the reach of other Instagram post types.
- Each day, Instagram users like 4.2 billion posts, comment 95 million times, and share millions of Stories.
4. Instagram business statistics
- Businesses heavily utilize Instagram for marketing and customer engagement. There are approximately 200 million business profiles on Instagram, and 90% of users follow at least one of them.
- Approximately 60% of users discover new products on Instagram, underlining its importance for brand discovery.
- Additionally, 87% of users take action, such as visiting a website or making a purchase, after viewing a brand’s post.
- Instagram’s shopping features, including Instagram Shops, have also seen widespread adoption, facilitating direct purchases from the app.
5. Instagram advertising statistics
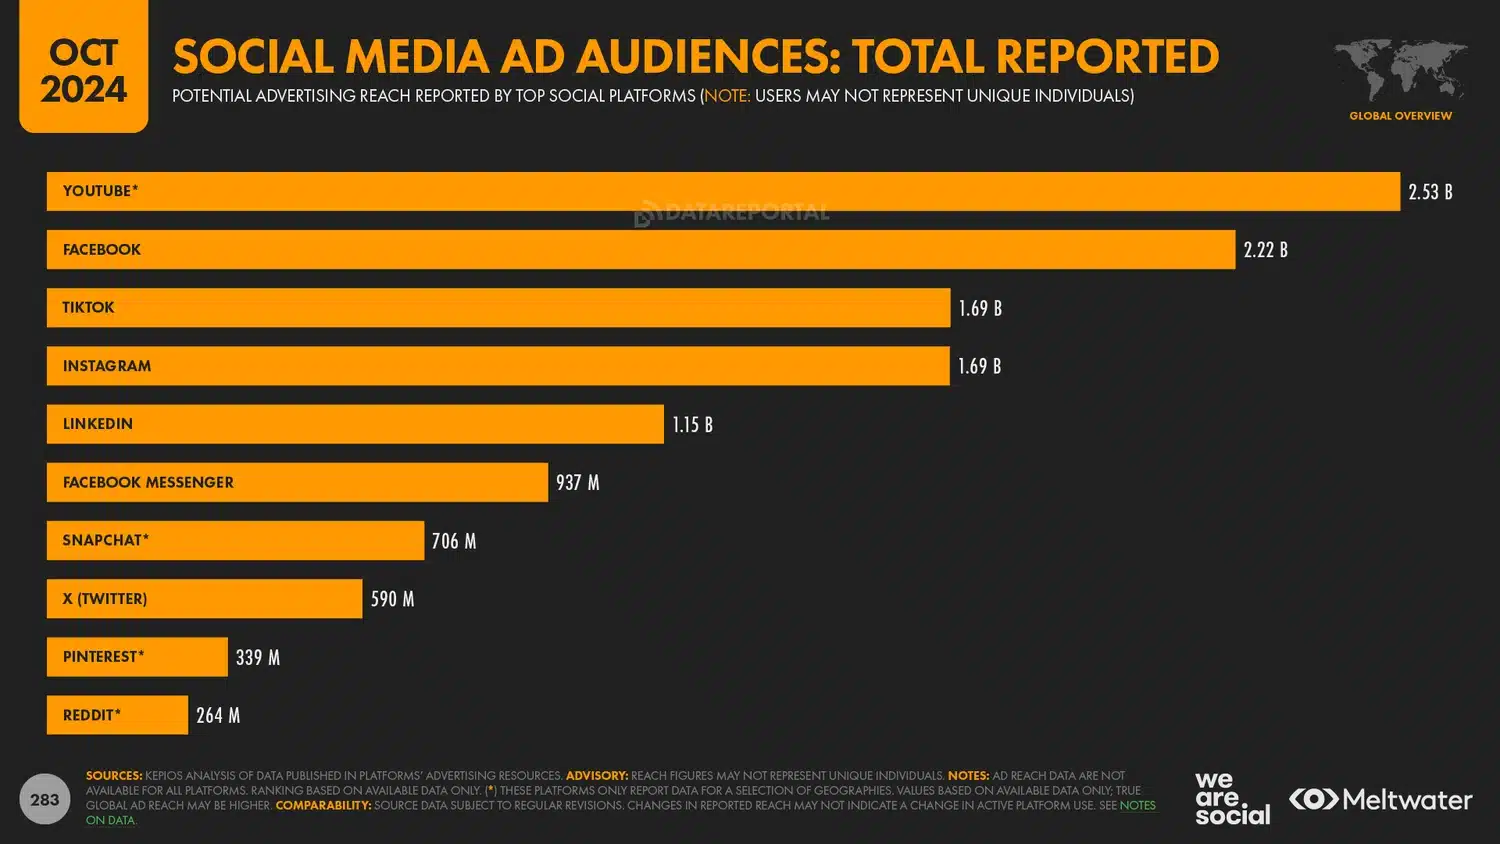
- The platform’s ad reach is over 1.628 billion users, providing advertisers with a vast audience.
- Instagram is set to make more than half of Meta’s ads revenue in 2025.
- More than 80% of marketers advertise their products on Instagram.
- Ads on Instagram’s feed have an average click-through rate of 0.22%, while ads in Stories have a higher CTR at 0.33%.
- Video ads, including Story ads, drive higher engagement, with video content seeing a 38% higher engagement rate than image posts.
X (Twitter) statistics you need to know
X, formerly known as Twitter, is still a significant player in the social media landscape in 2025. With a diverse user base and extensive global reach, X remains a critical platform for individuals, businesses, and advertisers.
Here are the most important X statistics you need to know:
1. X (Twitter) user demographics
- As of 2025, X has over 600 million monthly users with distinct demographic characteristics.
- The platform’s users are predominantly male, making up 68.7% of the user base, while female users account for 31.3% of its audience.
- The largest age group on X is users aged 25-34, representing 29.95% of its demographic, highlighting the platform’s appeal to young adults.
- X’s global reach is significant, with high user numbers in the United States, Japan, and India, indicating its widespread international appeal.
- Additionally, the platform has been noted for its varied user interests, ranging from news consumption to entertainment and business updates.
2. X (Twitter) usage statistics
- Users spend an average of 30.9 minutes per day on X.
- A quarter of X’s traffic comes from the United States.
3. X (Twitter) engagement statistics
- Engagement on X is driven significantly by multimedia content. Tweets that include videos attract ten times more engagement than those without, underscoring the importance of visual content in user interactions.
- Each day, users watch approximately 8 billion videos on X, highlighting the platform’s capacity to captivate its audience through video content.
4. X (Twitter) business statistics
- X is a great tool for businesses looking to engage with their audience. Business accounts on X have reported high levels of user engagement, with 54% of users likely to purchase new products from brands they follow on the platform.
- In 2023, X experienced a 5% decrease in average CPM and a 27% decrease in average cost-per-conversion.
5. X (Twitter) advertising statistics
- Advertising on X offers significant reach and engagement opportunities. The median engagement rate is 0.59%.
- Promoted Tweets with video content are 10 times more engaging and 50% cheaper in terms of cost-per-engagement.
- X ad revenue is declining, with estimates showing a 5.1% drop in 2024, and a predicted 4.8% drop in 2025 to $2.99 billion.
YouTube statistics you need to know
As the second largest search engine, YouTube continues to dominate as a leading platform for video content, with extensive reach and engagement.
Here’s what YouTube statistics you need to know:
1. YouTube user demographics
- YouTube’s user base is vast and diverse, reflecting its global reach. As of January 2025, YouTube boasts nearly 2.7 billion monthly active users, making it one of the largest social media platforms globally.
- The gender distribution is relatively balanced, with 54.4% male users and 45.6% female users.
- As of 2023, YouTube was the most popular social media site among Gen Z users with 96% of respondents in this age group reporting using this video platform. 86% have a favorable opinion about YouTube as a brand.
- The largest age group on YouTube is users aged 25-34, who account for 21.5% of its demographic, followed closely by the 35-44 age group at 17.9%.
- India leads with the largest number of active users, followed by the United States and Brazil.
2. YouTube usage statistics
- YouTube remains a powerhouse in online video consumption. On average, users spend about 40 minutes per session on YouTube, indicating deep engagement.
- The platform sees over 1 billion hours of video watched daily, highlighting its role as a leading source of video content.
- YouTube Shorts, a feature introduced to compete with TikTok, sees 70 billion daily views, showing rapid adoption and user interest.
3. YouTube engagement statistics
Engagement on YouTube is driven by its extensive video library and user interaction features.
The average engagement rate on YouTube was 3.87% in 2024, higher than many other platforms. Videos on YouTube see significant interaction, with users liking, commenting, and sharing content regularly.
4. YouTube business statistics
- Over 3 million US content creators and channels are active on YouTube, with many using the platform to drive business goals.
- Approximately 62% of businesses use YouTube to post video content, highlighting its importance in digital marketing strategies.
- YouTube helps about 90% of users discover new brands or products, emphasizing its role in brand discovery and customer acquisition.
- Additionally, YouTube’s shopping features, such as product links in videos, facilitate direct purchases from the platform, with over 40% of users making purchases after seeing a product on YouTube.
5. YouTube advertising statistics
Advertising on YouTube offers substantial reach and engagement opportunities. YouTube’s ad reach extends to over 2.5 billion users, providing advertisers with a vast audience of almost 31.5% of world’s population.

Source
Advertisers benefit from precise targeting options, enabling them to reach specific demographics effectively.
LinkedIn statistics you need to know
LinkedIn continues to be the go-to platform for professional networking and business engagement.
Here are some interesting LinkedIn statistics for 2025:
1. LinkedIn user demographics
- In 2025, LinkedIn has over 1 billion members worldwide, reflecting its significant reach among professionals.
- The platform’s gender distribution shows a slight male majority, with 57% male users and 43% female users.
- The largest age group on LinkedIn is users aged 25-34, accounting for about 50% of the user base, followed by users aged 35-54, who make up approximately 21%.
- The United States leads with the highest number of LinkedIn users, followed by India and China.
- LinkedIn’s appeal is particularly strong among professionals and businesses, making it a key platform for career development and industry networking.
2. LinkedIn usage statistics
- LinkedIn usage is focused on users highly engaged in professional content and networking. On average, LinkedIn sees over 310 million monthly active users, with significant daily interaction.
- Users spend an average of 17 minutes per session on LinkedIn.
- Mobile devices account for 57% of LinkedIn traffic, so it’s super important to focus on mobile-friendly content.
3. LinkedIn engagement statistics
- The average engagement rate on LinkedIn posts is 4.8%, higher than many other professional platforms.
- LinkedIn reports that it sees 2 new members join every second.
- 40% of monthly active users visit LinkedIn daily.
- LinkedIn posts with images receive 98% more comments than those without.
- Videos get shared 20 times more than any other content format on LinkedIn.
- LinkedIn Live streams increased by 89% year-over-year.


