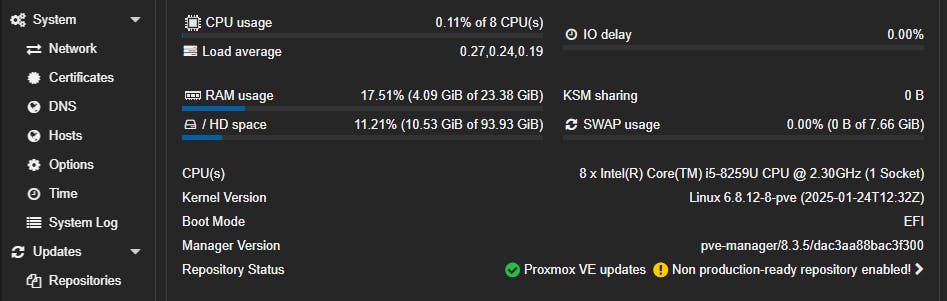
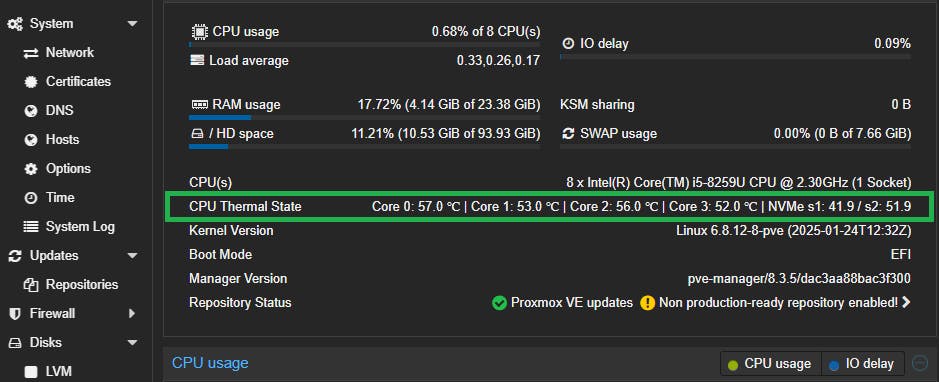
The Proxmox Virtual Environment (PVE) dashboard is not very informative by default. It only displays basic system information such as CPU details, Kernel Version, Boot Mode, Manager Version, and Repository Status. However, users may want to monitor additional system metrics like CPU and SSD temperatures.

While you can use the terminal and tools like lm-sensors to gather this data, it’s far more convenient to display it directly in the PVE GUI.
Let’s get started…
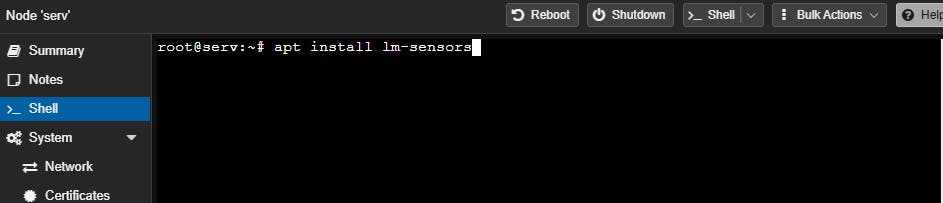
First, we need to install the lm-sensors package (if it’s not already installed). If it’s already present—great!
To install and detect your sensors, run:

Check it like this -> sensors

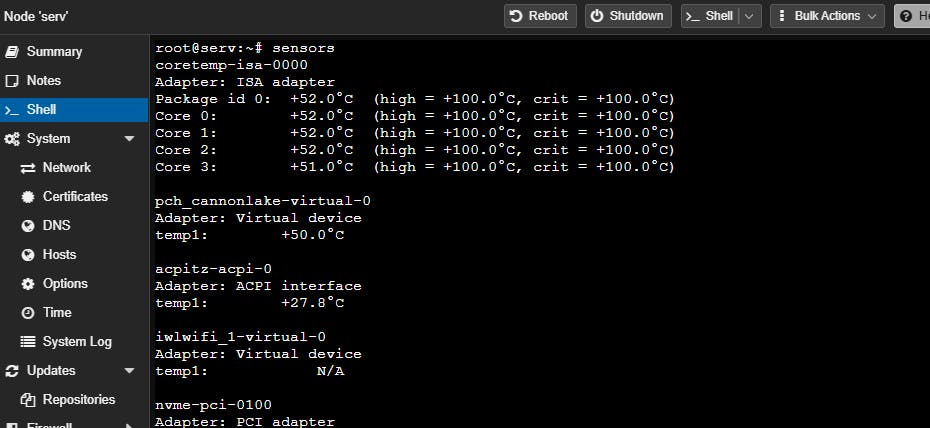
I’ll use SSH from a terminal (ssh root@ProxmoxIpAddress), but you can also use the PVE Shell.
Now that we have temperature data, the next step is to edit the Perl file Nodes.pm.
/usr/share/perl5/PVE/API2/Nodes.pm


I opened this file in Vi, but you can use Nano (your choice). Below are some common vi commands used in this post:
- Find something – that’s mean from Normal mode (default mode) type -> /
line that is needed. - Save or write to file – exactly the same like previous step, use the Normal mode and type -> :w
- Find the line -> :123 (example number of line).
- Save and exit -> :wq
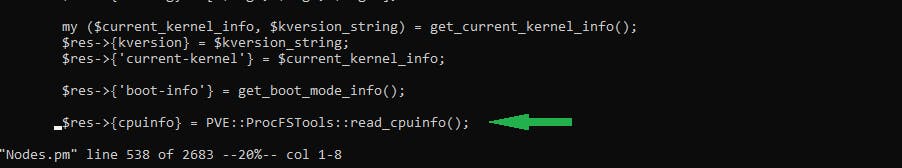
We need to find this line of code : $res->{cpuinfo}
To finding this place , type in search line –> $res->{cpuinfo}
(if you use Vi -> /$res->{cpuinfo} or /538 (Number of line)
Be attention if you find by number of line, because it’s may be little different in your case (not exactly 538).

Once you have found the desired line, write this code in the next line -> $res->{thermalstate} = `sensors`;

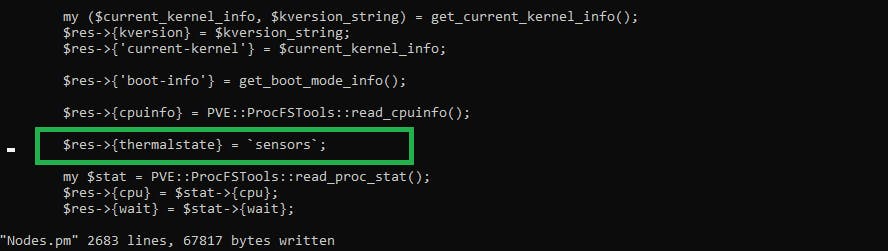
Save file and exit -> :wq
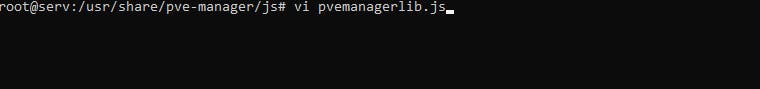
We also need to open another file – /usr/share/pve-manager/js vi pvemanagerlib.js

Find this line – > /widget.pveNodeStatus
Make some changes to height: 380 and bodyPadding: ’20 15 20 15’

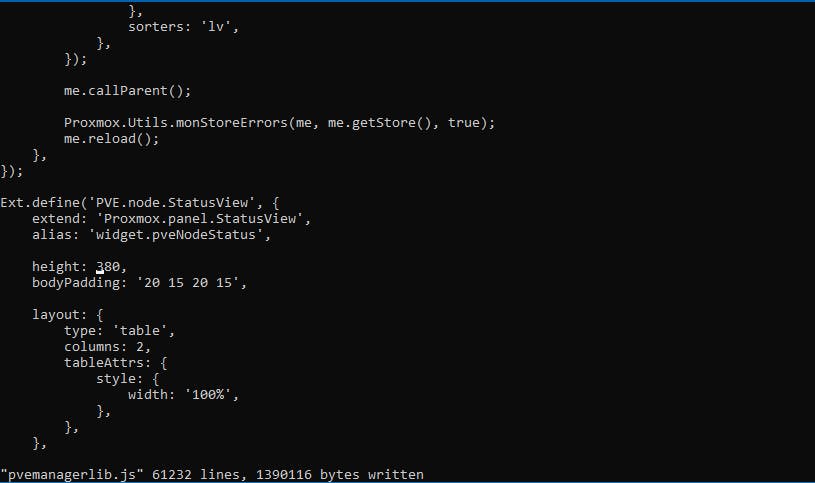
Save the changes (:w) but don’t close the file, you also need to add code to another part of this file.
Find this -> /gettext(‘CPU(s)’)

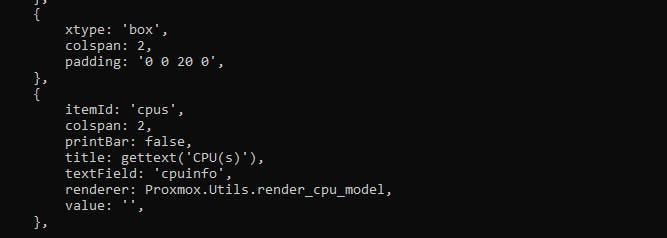
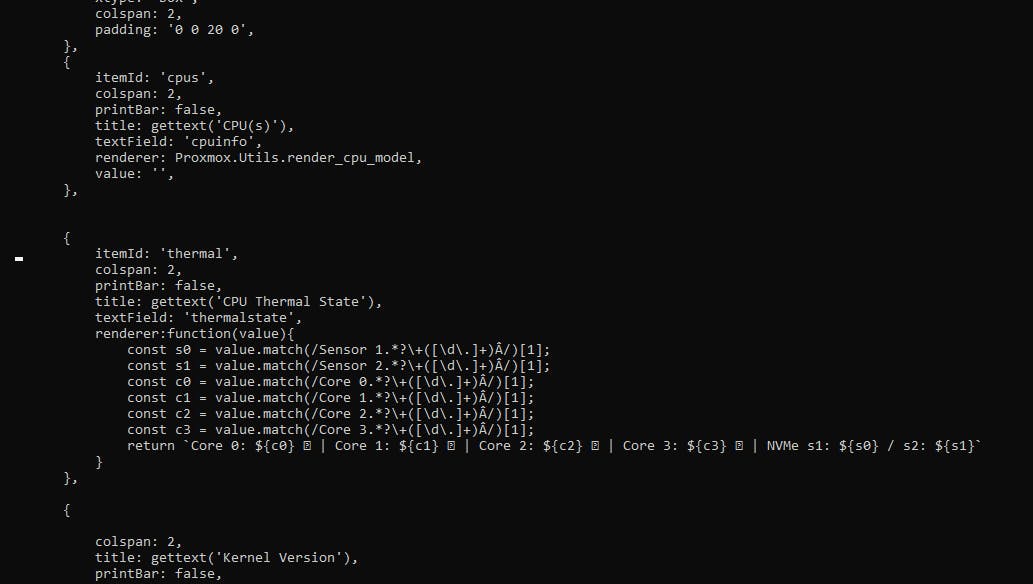
After this block of code where {itemId:’cpus’ ……. }, add this code
{
itemId: 'thermal',
colspan: 2,
printBar: false,
title: gettext('CPU Thermal State'),
textField: 'thermalstate',
renderer:function(value){
const s0 = value.match(/Sensor 1.*?\+([\d\.]+)Â/)[1];
const s1 = value.match(/Sensor 2.*?\+([\d\.]+)Â/)[1];
const c0 = value.match(/Core 0.*?\+([\d\.]+)Â/)[1];
const c1 = value.match(/Core 1.*?\+([\d\.]+)Â/)[1];
const c2 = value.match(/Core 2.*?\+([\d\.]+)Â/)[1];
const c3 = value.match(/Core 3.*?\+([\d\.]+)Â/)[1];
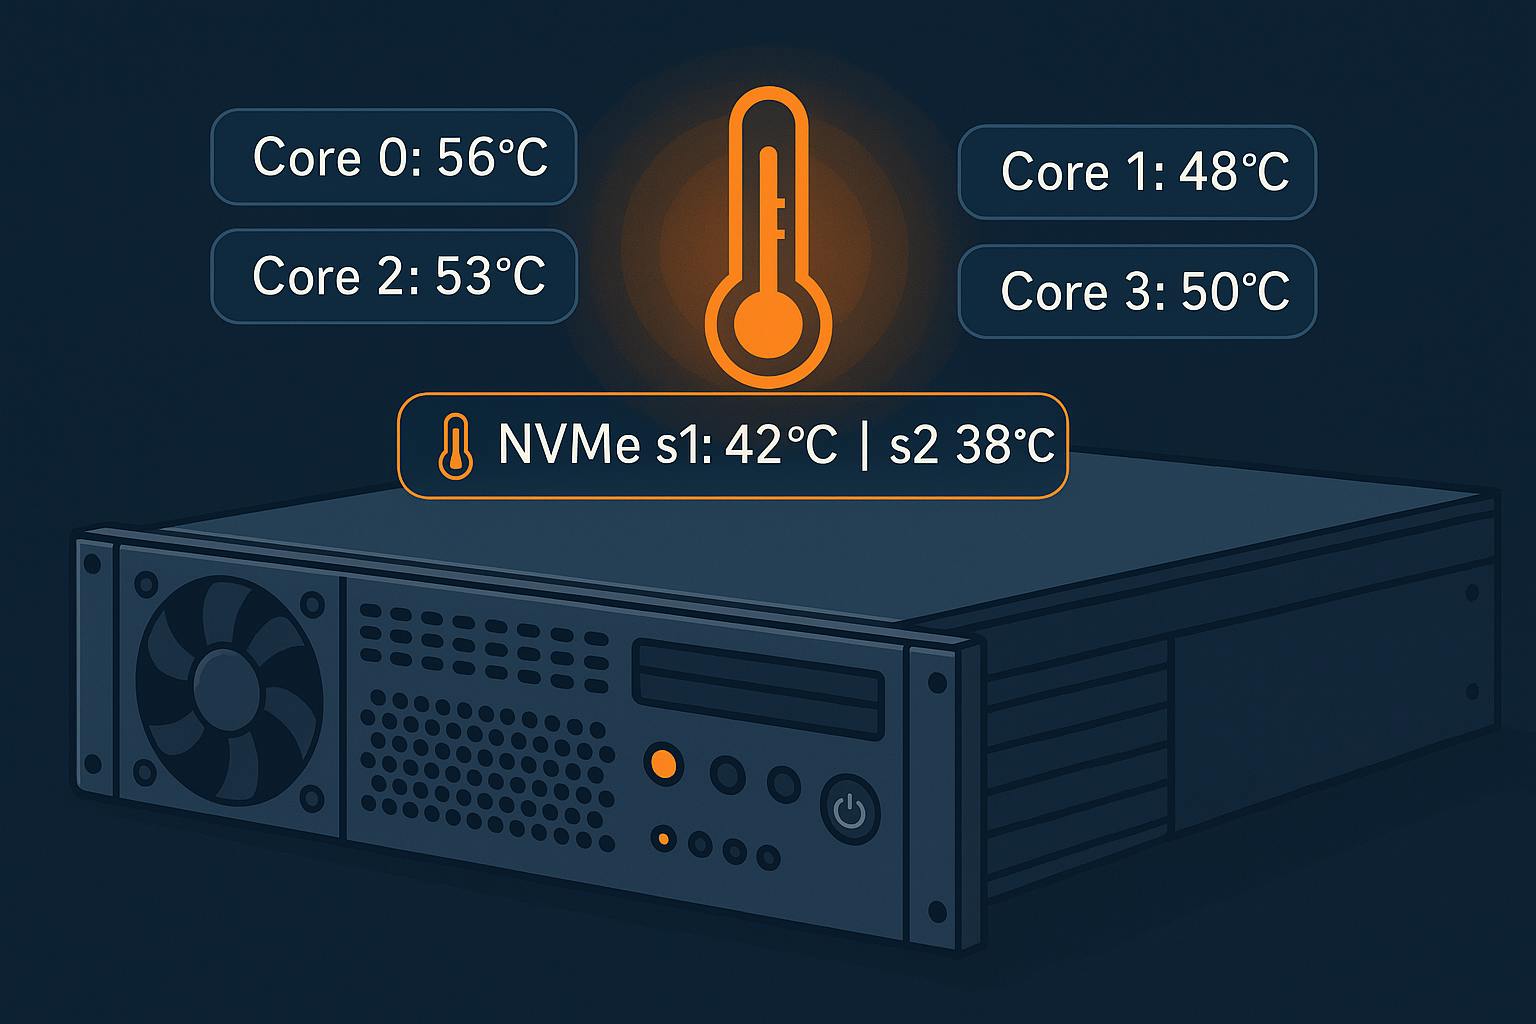
return `Core 0: ${c0} ℃ | Core 1: ${c1} ℃ | Core 2: ${c2} ℃ | Core 3: ${c3} ℃ | NVMe s1: ${s0} / s2: ${s1}`
}
}
In this example uses the four Cores and SSD device info like a controller temperature and memory. You can change the informativeness of the data relative to what lm-sensors shows you.

Ok, at now save and close file.
Once again, I would like to note that all examples of commands to operate file are given using the Vi editor as an example.
Next step restart PVE use this command -> systemctl restart pveproxy or reboot hardware manual.

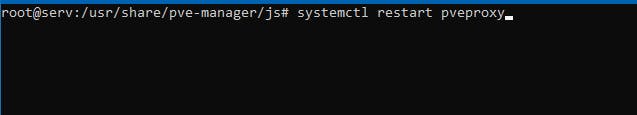
If you did everything correctly and didn’t corrupt the codebase in any way, the pveproxy process should reload without any errors and you will be able to see the changes you made.
In the result we have more informative interface which can use.


