9 Key Instagram Metrics to Track
If you’re wondering where to begin with Instagram analytics, the best place to start is by learning about Instagram metrics and which ones make the most sense with your business goal.
Here are some of the top Instagram metrics, and why you might consider tracking and reporting on them.
1. Views
Instagram has recently shifted its focus to tracking “views” as its primary metric, outlining how many times your content was viewed on the platform.
With the Instagram algorithm shifting to show users more content from creators and brands they aren’t following (yet), views give you a better idea of how your content is performing in the Instagram algorithm.
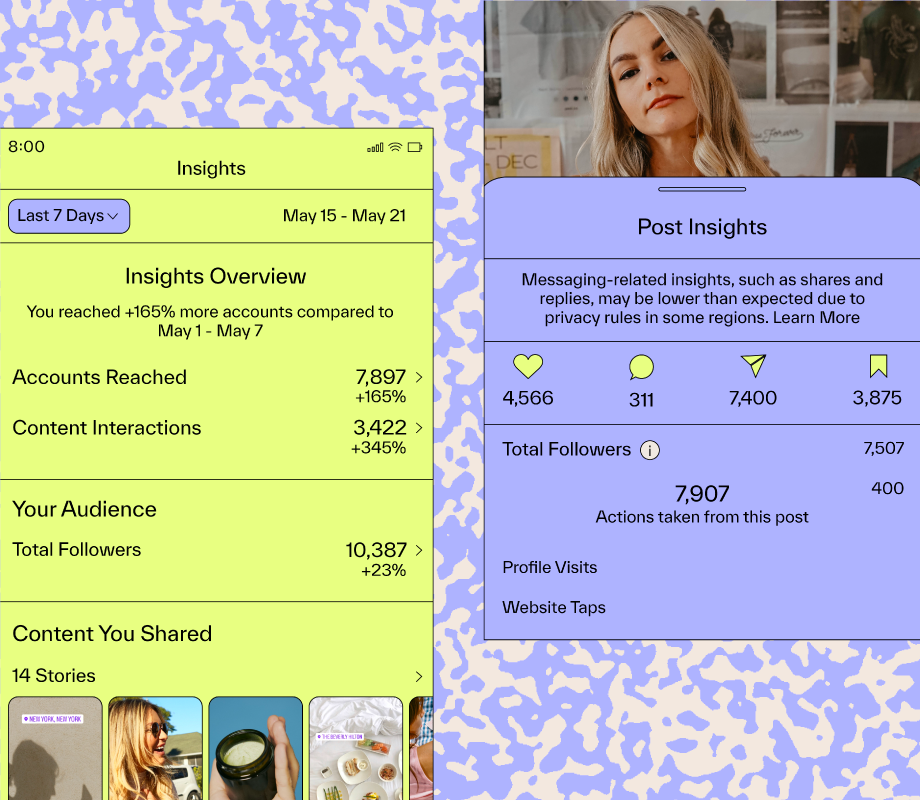
2. Reach
Reach is defined as the unique number of people who saw your post, Reel, or Instagram Story.
If you’re looking to reach a new audience, tracking reach shows you how many people had their eyes on your content.
3. Impressions
Similar to views, impressions are the number of times a post or Reel is seen on the platform.
Impressions can give you a good idea of how well your Instagram content is resonating with people who are reaching it.
While reach and impressions are similar metrics, they provide different insights into how your content is performing.
4. Traffic
Traffic is the number of clicks your website or Link in Bio page, calls-to-action, and Instagram Stories link stickers drive.
Traffic is a jackpot for understanding what motivates your audience and what web pages resonate with them best.
5. Saves
Saves are the number of times your post has been bookmarked. Review your Saves to see what content your audience finds most useful.
6. Shares
Shares indicate how many times a post was sent to another user through Instagram — and that’s a very telling metric when you want to know what grabs your audience’s attention and the impression that you’re making on people who might not be familiar with your brand.
Note: Instagram has recently reformatted its analytics, with Shares now called “Sends per Reach” in the platform.
7. Audience Growth
Thanks to Instagram’s “followed” and “unfollowed” metrics — you can see exactly how many followers you gain and lose each day.
This can help you further understand what content brings in new followers and what your audience doesn’t like.
8. Watch-Through Rate
Your Instagram Stories’ and Reels’ watch-through rate measures the percentage of people who followed your content from beginning to end.
This metric gives you an idea of what video content performs best and where to place calls to action throughout your videos so your followers actually see it.
9. Engagement Rate
An Instagram engagement rate is a calculation that shows what percentage of the people you’ve reached interact with your content.
The calculation compares the number of likes, comments, and saves a post receives to your overall reach.
Trying to figure out your engagement rate – or someone else’s? Try our Instagram Influencer Engagement Rate calculator.


