By using this site, you agree to the Privacy Policy and Terms of Use.
Accept
World of SoftwareWorld of SoftwareWorld of Software
  • News
  • Software
  • Mobile
  • Computing
  • Gaming
  • Videos
  • More
    • Gadget
    • Web Stories
    • Trending
    • Press Release
Search
  • Privacy
  • Terms
  • Advertise
  • Contact
Copyright © All Rights Reserved. World of Software.
Reading: Boosting Anatomical Retrieval Accuracy with Re-Ranking Methods | HackerNoon
Share
Sign In
Notification Show More
Font ResizerAa
World of SoftwareWorld of Software
Font ResizerAa
  • Software
  • Mobile
  • Computing
  • Gadget
  • Gaming
  • Videos
Search
  • News
  • Software
  • Mobile
  • Computing
  • Gaming
  • Videos
  • More
    • Gadget
    • Web Stories
    • Trending
    • Press Release
Have an existing account? Sign In
Follow US
  • Privacy
  • Terms
  • Advertise
  • Contact
Copyright © All Rights Reserved. World of Software.
World of Software > Computing > Boosting Anatomical Retrieval Accuracy with Re-Ranking Methods | HackerNoon
Computing

Boosting Anatomical Retrieval Accuracy with Re-Ranking Methods | HackerNoon

News Room
Last updated: 2025/08/28 at 6:48 AM
News Room Published 28 August 2025
Share
SHARE

Table of Links

Abstract and 1. Introduction

  1. Materials and Methods

    2.1 Vector Database and Indexing

    2.2 Feature Extractors

    2.3 Dataset and Pre-processing

    2.4 Search and Retrieval

    2.5 Re-ranking retrieval and evaluation

  2. Evaluation and 3.1 Search and Retrieval

    3.2 Re-ranking

  3. Discussion

    4.1 Dataset and 4.2 Re-ranking

    4.3 Embeddings

    4.4 Volume-based, Region-based and Localized Retrieval and 4.5 Localization-ratio

  4. Conclusion, Acknowledgement, and References

3.2 Re-ranking

This section presents the retrieval recalls after applying the re-ranking method of Section 2.5.

3.2.1 Volume-based

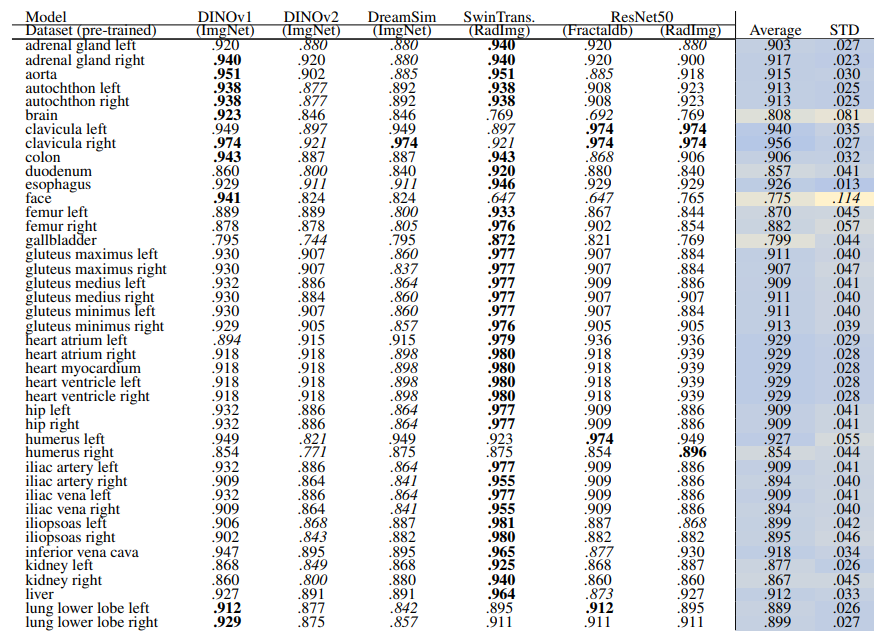
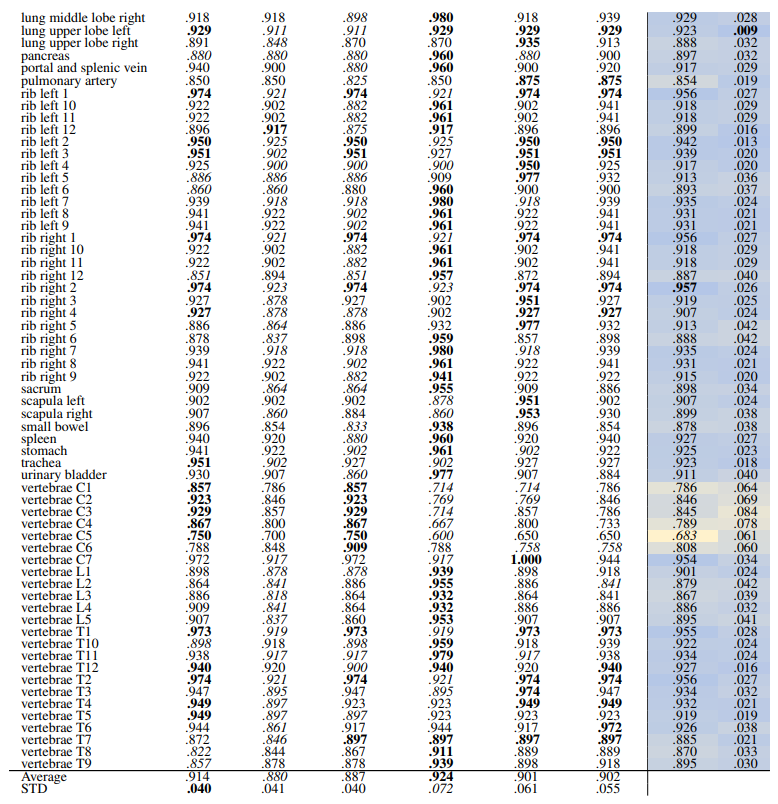
Table 12 and Table 13 show the retrieval recalls for 29 coarse anatomical structures and 104 original TS anatomical structures using the proposed re-ranking method. All the recalls are improved using re-ranking. The performance of the models for 29 classes is close with only slight differences. DINOv1 and DreamSim have a slightly better recall in comparison, with an average recall of .967 but the standard deviation of DINOv1 is slightly lower (.040 vs. .045). In 104 anatomical regions, SwinTransformer performs better than the other models with an average recall of .924 but its standard deviation (.072) is the lowest.
Continue with the next figure

Table 13: Volume-based retrieval recall of all TS anatomical regions (104 classes) using HNSW Indexing and re-ranking. In each row, bold numbers represent the best-performing values, while italicized numbers indicate the worst-performing. The separate average and standard deviation (STD) columns are color-coded, with blue indicating the best-performing values and yellow indicating the worst-performing values across different models. Additionally, bold numbers in colored columns represent the best classes in terms of average and standard deviation, while italicized values represent the worst-performing class across the models.

3.2.2 Region-based

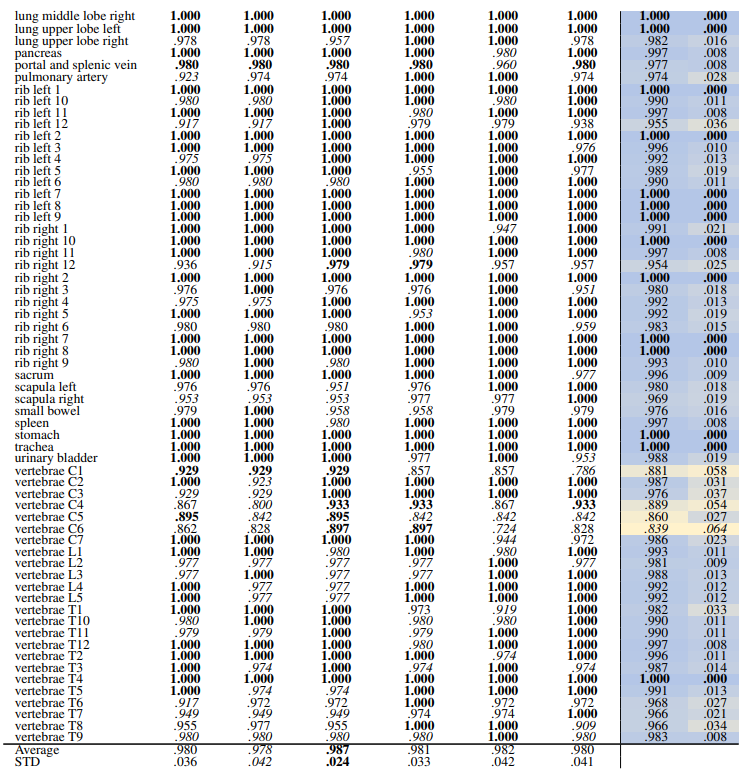
Table 14 and Table 15 show the retrieval recall for 29 coarse anatomical structures and 104 original TS anatomical structures employing the proposed re-ranking method. Using the re-ranking, the overall performance of all the models has improved. DreamSim performs the best with the average retrieval recall of .987 ± .027 and .987 ± .024 for 29 and 104 classes, respectively. There are only slight variations between the performance on coarse and all the original TS classes. Similar to the count-based method in the anatomical region retrieval many classes are perfectly retrieved (recall of 1.0). There is a low variation among models and between classes where the highest standard deviation is .064 and .042.
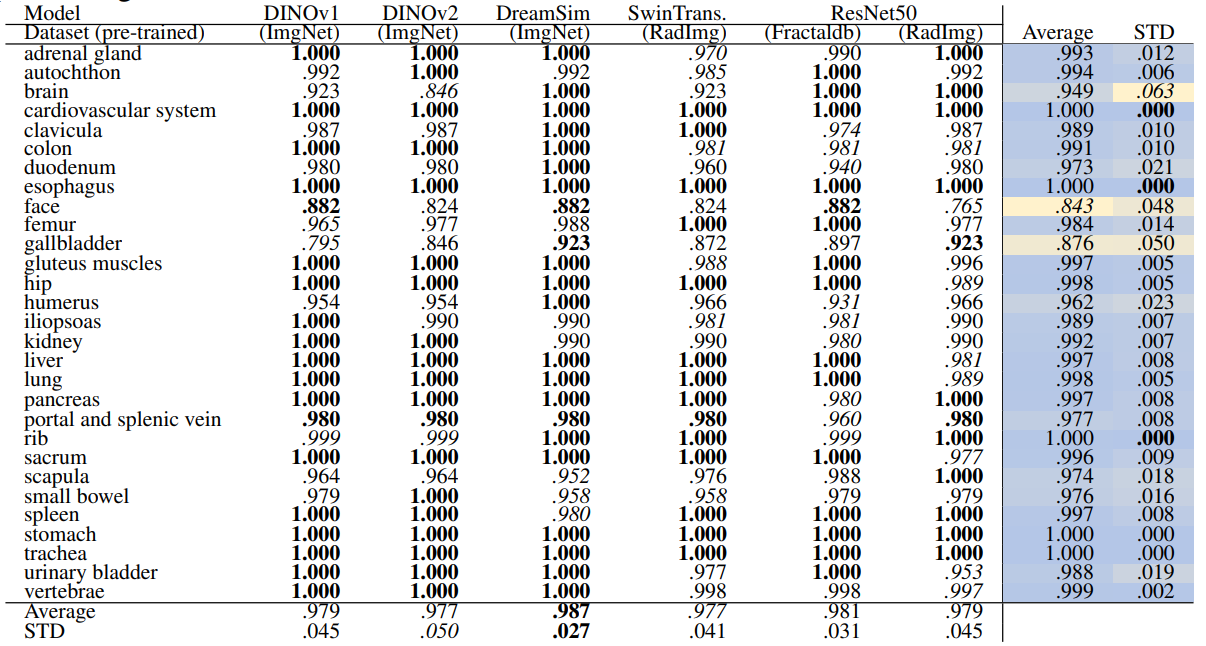
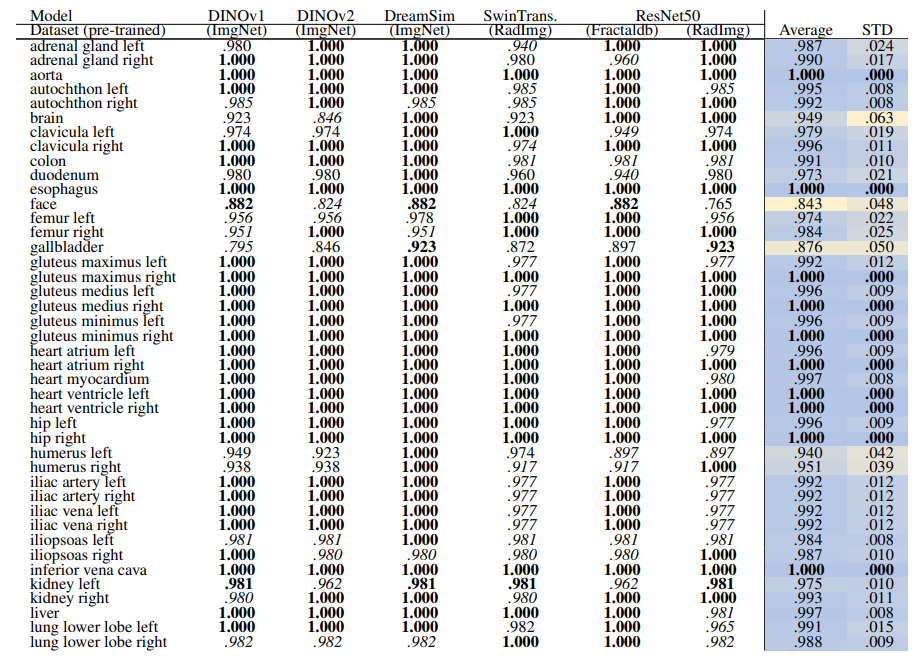
Table 14: Region-based retrieval recall of coarse anatomical regions (29 classes) using HNSW Indexing and re-ranking. In each row, bold numbers represent the best-performing values, while italicized numbers indicate the worst-performing. The separate average and standard deviation (STD) columns are color-coded, with blue indicating the best performing values and yellow indicating the worst-performing values across different models. Additionally, bold numbers in colored columns represent the best classes in terms of average and standard deviation, while italicized values represent the worst-performing class across the models.

Continue with the next figure

Table 15: Region-based retrieval recall of all TS anatomical regions (104 classes) using HNSW Indexing and re-ranking. In each row, bold numbers represent the best-performing values, while italicized numbers indicate the worst-performing. The separate average and standard deviation (STD) columns are color-coded, with blue indicating the best-performing values and yellow indicating the worst-performing values across different models. Additionally, bold numbers in colored columns represent the best classes in terms of average and standard deviation, while italicized values represent the worst-performing class across the models.

3.2.3 Localized

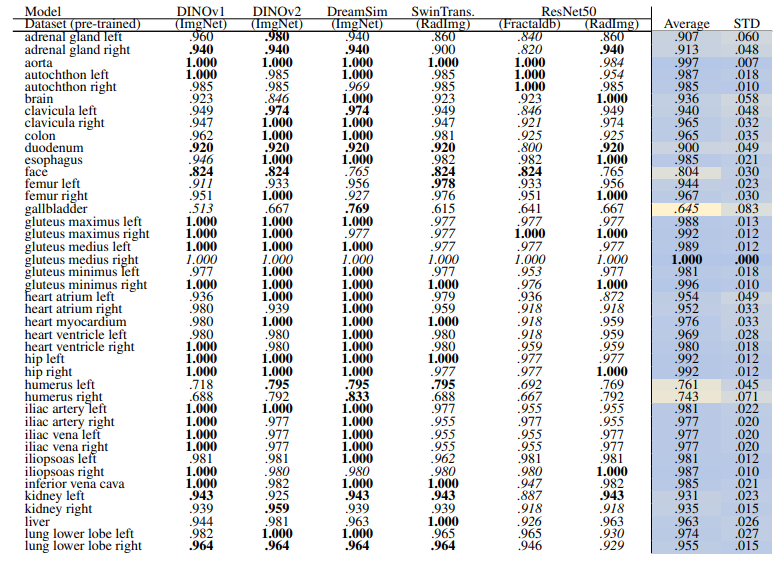
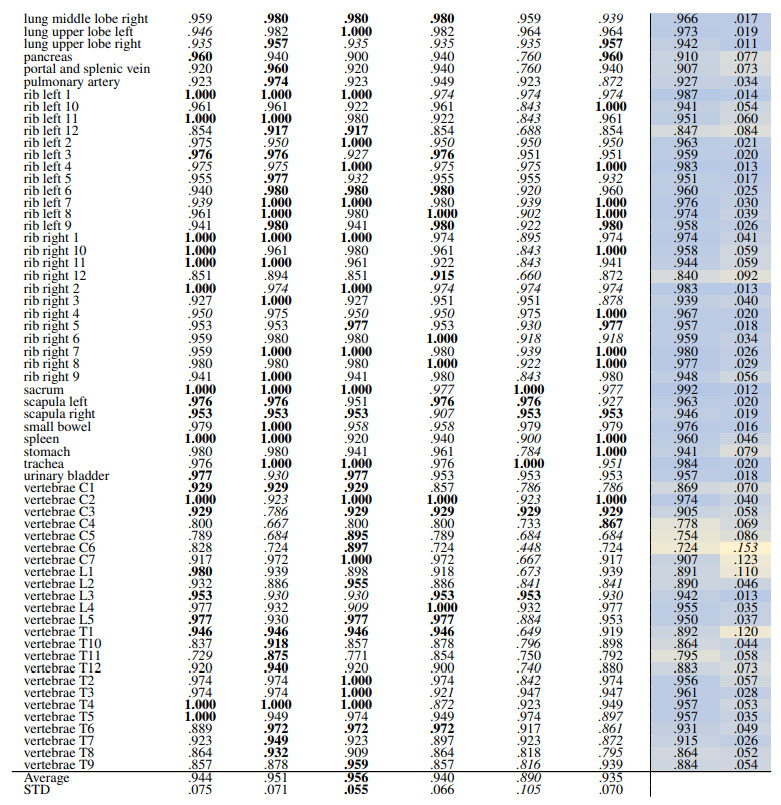
Localized Retrieval Recall Table 16 and Table 17 show the retrieval recall for 29 coarse anatomical structures and 104 original TS anatomical structures after re-ranking for L = 15. Re-ranking improved the localization for all the models. DreamsSim is the best-performing model with an average recall of .955 ± .062 for coarse anatomical structures and .956 ± .055 for original TS classes. Although the retrieval is lower compared to region-based or volume-based evaluation, it is still high which shows that the pretrained vision embeddings not only can retrieve similar cases but also can localize the corresponding region of interest.
Continue with the next figure

Table 17: Localized retrieval recall of all TS anatomical regions (104 classes) using HNSW Indexing and re-ranking, L = 15. In each row, bold numbers represent the best-performing values, while italicized numbers indicate the worst-performing. The separate average and standard deviation (STD) columns are color-coded, with blue indicating the best-performing values and yellow indicating the worst-performing values across different models. Additionally, bold numbers in colored columns represent the best classes in terms of average and standard deviation, while italicized values represent the worst-performing class across the models.

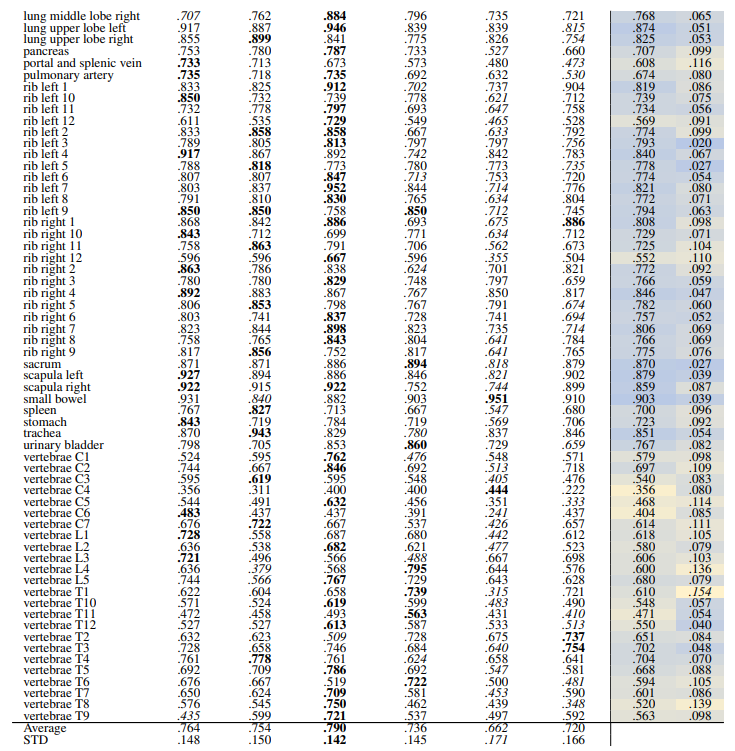
Localization-ratio The localization-ratio is calculated based on (7). Table 18 and Table 19 demonstrate the localization-ratio for 29 coarse and 104 original TS anatomical regions after re-ranking for L = 15. The bestperforming embedding is still DreamSim with a localization-ratio of .837 ± .159 and .790 ± .142 for 29 coarse and 104 original TS classes. After re-ranking the overall localization-ratio is reduced (previously, .864 ± .0145 and .803 ± .130, respectively).
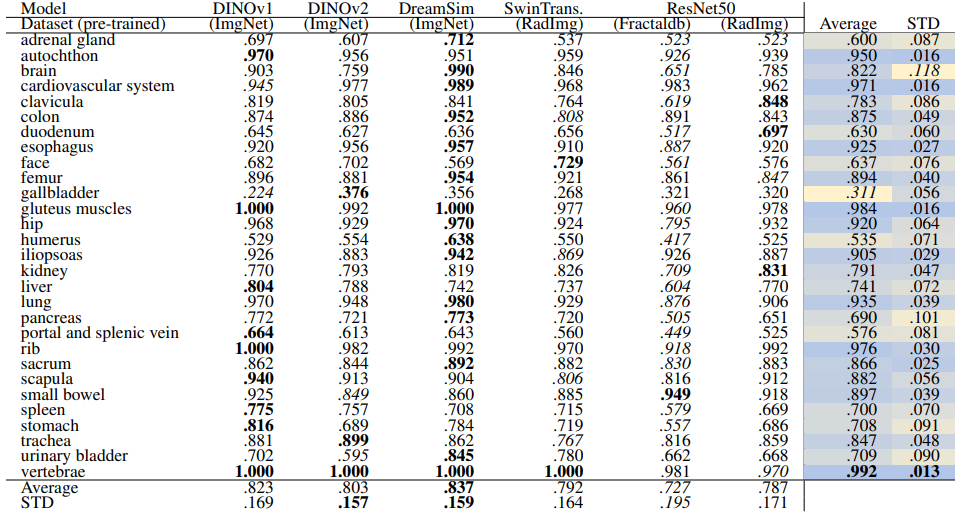
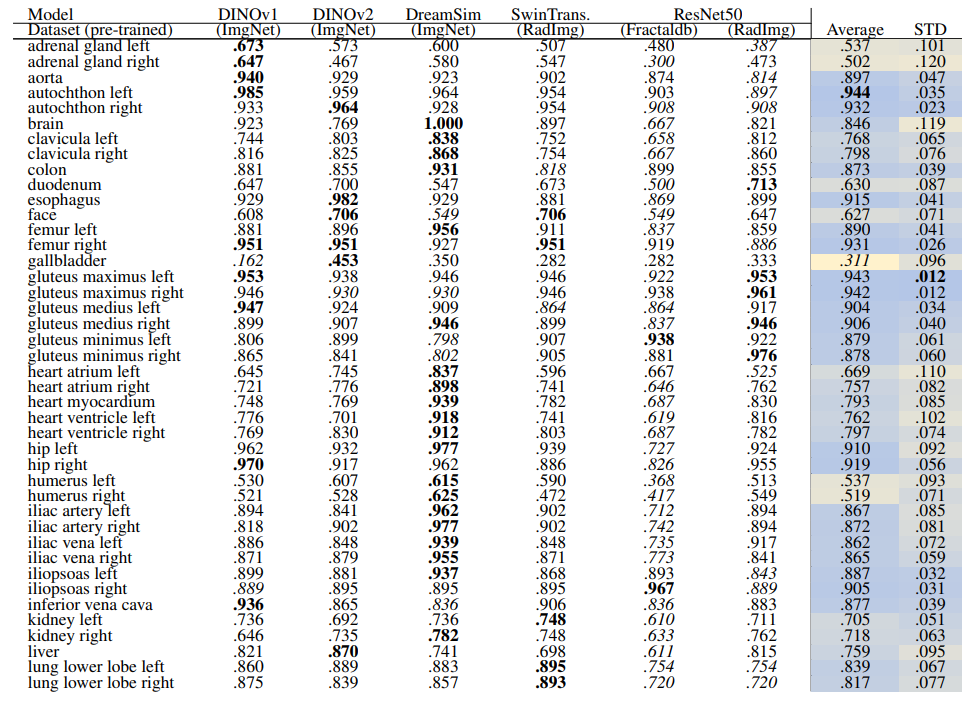
Table 18: Localization-ratio of coarse anatomical regions (29 classes) using HNSW Indexing and re-ranking, L = 15. In each row, bold numbers represent the best-performing values, while italicized numbers indicate the worst-performing. The separate average and standard deviation (STD) columns are color-coded, with blue indicating the best-performing values and yellow indicating the worst-performing values across different models. Additionally, bold numbers in colored columns represent the best classes in terms of average and standard deviation, while italicized values represent the worst-performing class across the models.

Continue with the next figure

Table 19: Localization-ratio of all TS anatomical regions (104 classes) using HNSW Indexing and re-ranking, L = 15. In each row, bold numbers represent the best-performing values, while italicized numbers indicate the worst-performing. The separate average and standard deviation (STD) columns are color-coded, with blue indicating the best-performing values and yellow indicating the worst-performing values across different models. Additionally, bold numbers in colored columns represent the best classes in terms of average and standard deviation, while italicized values represent the worst-performing class across the models.

:::info
Authors:

(1) Farnaz Khun Jush, Bayer AG, Berlin, Germany ([email protected]);

(2) Steffen Vogler, Bayer AG, Berlin, Germany ([email protected]);

(3) Tuan Truong, Bayer AG, Berlin, Germany ([email protected]);

(4) Matthias Lenga, Bayer AG, Berlin, Germany ([email protected]).

:::


:::info
This paper is available on arxiv under CC BY 4.0 DEED license.

:::

Sign Up For Daily Newsletter

Be keep up! Get the latest breaking news delivered straight to your inbox.
By signing up, you agree to our Terms of Use and acknowledge the data practices in our Privacy Policy. You may unsubscribe at any time.
Share This Article
Facebook Twitter Email Print
Share
What do you think?
Love0
Sad0
Happy0
Sleepy0
Angry0
Dead0
Wink0
Previous Article CNCF Incubates OpenYurt for Kubernetes at the Edge
Next Article Long-running Apple TV+ comedy to be seen by a new audience on the BBC – 9to5Mac
Leave a comment

Leave a Reply Cancel reply

Your email address will not be published. Required fields are marked *

Stay Connected

248.1k Like
69.1k Follow
134k Pin
54.3k Follow

Latest News

What Would Happen If We Got Rid Of Daylight Savings Time? – BGR
News
How to Generate Images Using ChatGPT? |
Computing
The best Labor Day sales on TVs
News
Maisa AI reels in $25M for its AI agent development platform – News
News

You Might also Like

Computing

How to Generate Images Using ChatGPT? |

24 Min Read
Computing

Wikipedia Rules Everything Around Me | HackerNoon

8 Min Read
Computing

Seattle startups Clarify, Dropzone AI, Statsig, land on Madrona’s latest IA40 list of top AI companies

3 Min Read
Computing

I installed these PowerShell modules and they changed how I work

8 Min Read
//

World of Software is your one-stop website for the latest tech news and updates, follow us now to get the news that matters to you.

Quick Link

  • Privacy Policy
  • Terms of use
  • Advertise
  • Contact

Topics

  • Computing
  • Software
  • Press Release
  • Trending

Sign Up for Our Newsletter

Subscribe to our newsletter to get our newest articles instantly!

World of SoftwareWorld of Software
Follow US
Copyright © All Rights Reserved. World of Software.
Welcome Back!

Sign in to your account

Lost your password?