
Table Of Links
Abstract
1 Introduction
2 Original Study: Research Questions and Methodology
3 Original Study: Validity Threats
4 Original Study: Results
5 Replicated Study: Research Questions and Methodology
6 Replicated Study: Validity Threats
7 Replicated Study: Results
8 Discussion
9 Related Work
10 Conclusions And References
4 Original Study: Results
Of the 32 students participating in the experiment, nine did not complete the questionnaire11 and were removed from the analysis. Table 9 shows the balance of the experiment before and after participants submitted the questionnaire. We can see that G6 is the most affected group, with 4 missing people.
Appendix B shows the analysis of the experiment. The results show that program and technique are statistically significant (and therefore are influencing effectiveness), while group and the technique by program interaction are not significant. As regards the techniques, EP shows a higher effectiveness, followed by BT and then by CR. These results are interesting, as all techniques are able to detect all defects. Additionally, more defects are found in ntree compared to cmdline and nametbl, where the same amount of defects are found.
Note that ntree is the program applied the first day, has the highest Halstead metrics, and it is not the smallest program or the one with lowest complexity. These results suggest that:
– There is no maturation effect. The program where highest effectiveness is obtained is the one used the first day.
– There is no interaction with selections effect. Group is not significant.
– Mortality does not affect experimental results. The analysis technique used (Linear Mixed-Effects Models) is robust to lack of balance.
– Order of training could be affecting results. The highest effectiveness is obtained in the last technique taught, while the lowest effectiveness is obtained in the first technique taught. This suggests that techniques taught last are more effective than techniques taught first. This could be due to participants remembering better last techniques.
– Results cannot be generalised to other subject types.
4.1 RQ1.1: Participants’ Perceptions
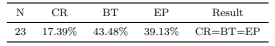
Table 10 shows the percentage of participants that perceive each technique to be the most effective. We cannot reject the null hypothesis that the frequency distribution of the responses to the questionnaire item (Using which technique did you detect most defects? ) follows a uniform distribution12 (χ 2 (2,N=23)=2.696, p=0.260). This means that the number of participants perceiving a particular technique as being more effective cannot be considered different for all three techniques. Our data do not support the conclusion that techniques are differently frequently perceived as being the most effective.
4.2 RQ1.2: Comparing Perceptions with Reality
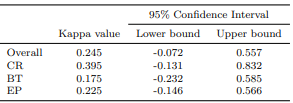
Table 11 shows the value of kappa along with its 95% confidence interval (CI), overall and for each technique separately. We find that all values for kappa with respect to the questionnaire item (Using which technique did you detect most defects?) are consistent with lack of agreement (κ<0.4, poor). Although the upper bound of the 95% CIs show agreement, 0 belongs to all 95% CI, meaning that agreement by chance cannot be ruled out. Therefore, our data do not support the conclusion that participants correctly perceive the most effective technique for them.
It is worth noting that agreement is higher for the code review technique (the upper bound of the 95% CI in this case shows excellent agreement). This could be attributed to participants being able to remember the actual number of defects identified in code reading whereas for testing techniques they only wrote the test cases. On the other hand, participants do not know the number of defects injected in each program.
As lack of agreement cannot be ruled out, we examine whether the perceptions are biased. The results of the Stuart-Maxwell test show that the null hypothesis of existence of marginal homogeneity cannot be rejected (χ 2 (2,N=23)=1.125, p=0.570). This means that we cannot conclude that perceptions and reality are differently distributed. Taking into account the results reported in Section 4.1, this would suggest that, in reality, techniques cannot be considered the most effective a different number of times13.
Additionally, the results of the McNemar-Bowker test show that the null hypothesis of existence of symmetry cannot be rejected (χ 2 (3,N=23)=1.286, p=0.733). This means that we cannot conclude that there is directionality when participants’ perceptions are wrong. These two results suggest that participants are not differently mistaken about one technique as they are about the others. Techniques are not differently subject to misperceptions.
4.3 RQ1.3: Comparing the Effectiveness of Techniques
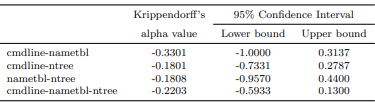
We are going to check if misperceptions could be due to participants detecting the same amount of defects with all three techniques, and therefore being impossible for them to make the right decision. Table 12 shows the value and 95% CI of Krippendorff’s α, overall and for each pair of techniques, for all participants and for every design group (participants that applied the same technique on the same program) separately, and Table 13 shows the value and 95% CI of Krippendorff’s α, overall and for each program/session.
For values with all participants, we can rule out agreement, as the upper bound of the 95% CIs are consistent with lack of agreement (α<0.4), except for the case of EP-BT and nametbl-ntree for which the upper bound of the 95% CIs are consistent with fair to good agreement. However, even in this two cases, 0 belongs to the 95% CIs, meaning that agreement by chance cannot be ruled out.
This means that participants do not obtain similar effectiveness values when applying the different techniques (testing the different programs) so as to be difficult to discriminate among techniques/programs.
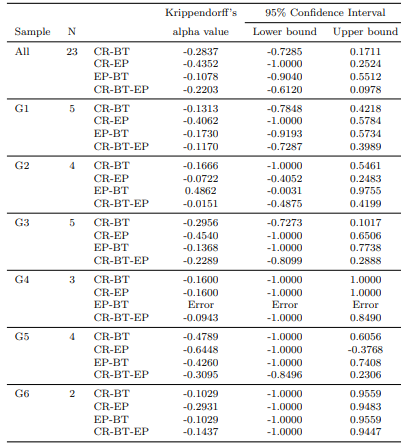
Furthermore, kappa values are negative, which indicates disagreement. This is good for the study, as it means that participants should be able to discriminate among techniques, and lack of agreement cannot be attributed to a problem of being impossible to discriminate among techniques. As regards the results for groups, although α values are negative14, the 95% CIs are too wide to show reliable results (due to small sample size). Note that in most of the cases they range from existence of disagreement in the lower bound (α0.4).
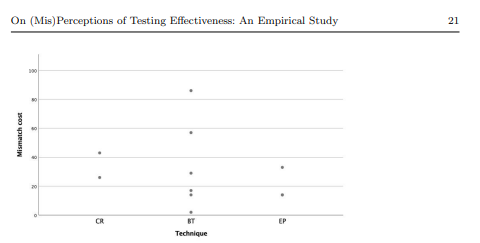
4.4 RQ1.4: Cost of Mismatch
Table 14 and Figure 1 show the cost of mismatch. We can see that the EP technique has fewer mismatches compared to the other two. Additionally, the mean and median mismatch cost is smaller. On the other hand, the BT technique has more mismatches, and a higher dispersion. The results of the Kruskal-Wallis test reveal that we cannot reject the null hypothesis of techniques having the same mismatch cost (H(2)=0.685, p=0.710). This means that we cannot claim a difference in mismatch cost between the techniques. The estimated mean mismatch cost is 31pp (median 26pp).
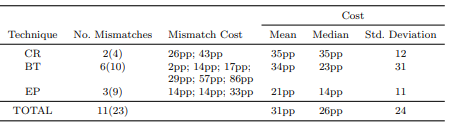
These results suggest that the mismatch cost is not negligible (31pp), and is not related to the technique perceived as most effective. However, note that the existence of very high mismatches and few datapoints could be affecting these results.
4.5 RQ1.5: Expected Loss of Effectiveness
Table 15 shows the average loss of effectiveness that should be expected in a project, where typically different testers participate, and therefore, there would
be both matches and mismatches15. Again, the results of the Kruskal-Wallis test reveal that we cannot reject the null hypothesis of techniques having the same expected reduction in technique effectiveness for a project (H(2)=1.510, p=0.470). This means we cannot claim a difference in project effectiveness loss between techniques. The mean expected loss in effectiveness in the project is estimated as 15pp16 .
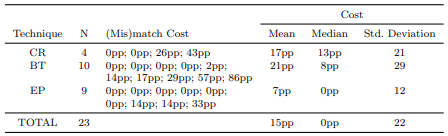
These results suggest that the expected loss in effectiveness in a project is not negligible (15pp), and is not related to the technique perceived as most effective. However, we must note again that the existence of very high mismatches for BT and few datapoints could be affecting these results.
4.6 Findings of the Original Study
Our findings are:
– Participants should not base their decisions on their own perceptions, as their perceptions are not reliable and have an associated cost.
– We have not been able to find a bias towards one or more particular techniques that might explain the misperceptions.
– Participants should have been able to identify the different effectiveness of techniques.
– Misperceptions cannot be put down to experience. The possible drivers of these misperceptions require further research. Note that these findings cannot be generalised to other types of developers rather than those with the same profile as the ones used in this study.
:::info
Authors:
- Sira Vegas
- Patricia Riofr´ıo
- Esperanza Marcos
- Natalia Juristo
:::
:::info
This paper is available on arxiv under CC BY-NC-ND 4.0 license.
:::


