
In this article, I explain how I enhanced and integrated the CISA Known Exploited Vulnerabilities (KEV) catalog into my vulnerability management platform. Additionally, I compare the signals from CISA KEV with those from a commercial vulnerability management platform.
CISA KEV (U.S. Cybersecurity and Infrastructure Security Agency Known Exploited Vulnerabilities Catalog) is a curated list of vulnerabilities that have confirmed evidence of active exploitation.
When a Single Vendor’s Expertise Is Not Enough
Most modern vulnerability management (VM) platforms maintain their own indicators of actively exploited vulnerabilities. While these vendors rely on their internal threat and vulnerability intelligence there can be discrepancies in the signals provided by vendors and those from the CISA KEV (Known Exploited Vulnerabilities). n n A sound strategy for any Security Operations Center (SOC) is to augment the signals from the VM platform with as many independent and authoritative sources of data as possible.
CISA KEV Integration and Data Enrichment
Integration options can differ based on the organization and its current tools. To illustrate this concept, I have created a simple, high-level diagram that demonstrates the fundamental ideas behind enriching VM data with CISA KEV signals.
I use the approach illustrated on the right. For input sources, I rely on the official CISA KEV export and an export from the VM platform that identifies vulnerabilities flagged as actively exploited.
At a high level, the integration process works as follows: n 1. A script retrieves the current vulnerability list from the VM platform via its API. n 2. The script downloads the KEV dataset from the official CISA source. n 3. The data is normalized, parsed, and merged using the CVE identifier as the key matching condition. n 4. A prioritization rule is applied to each vulnerability. If it is marked as actively exploited by the vendor and/or is present in the CISA KEV, it is assigned an elevated priority.
Research Findings and Impact
The research aspect of this project was the most compelling for me. The objective was to validate the practical impact of integrating CISA KEV in my case. To achieve this, I defined a set of indicators, performed statistical calculations using Python and Pandas in JupyterLab, and visualized the results with Matplotlib. The datasets utilized for the analysis consisted of the CISA KEV export in CSV format and an export of actively exploited vulnerabilities from a commercial VM solution.
For those interested in a more detailed overview of the research, I provide a link to the Jupyter Notebook on GitHub.
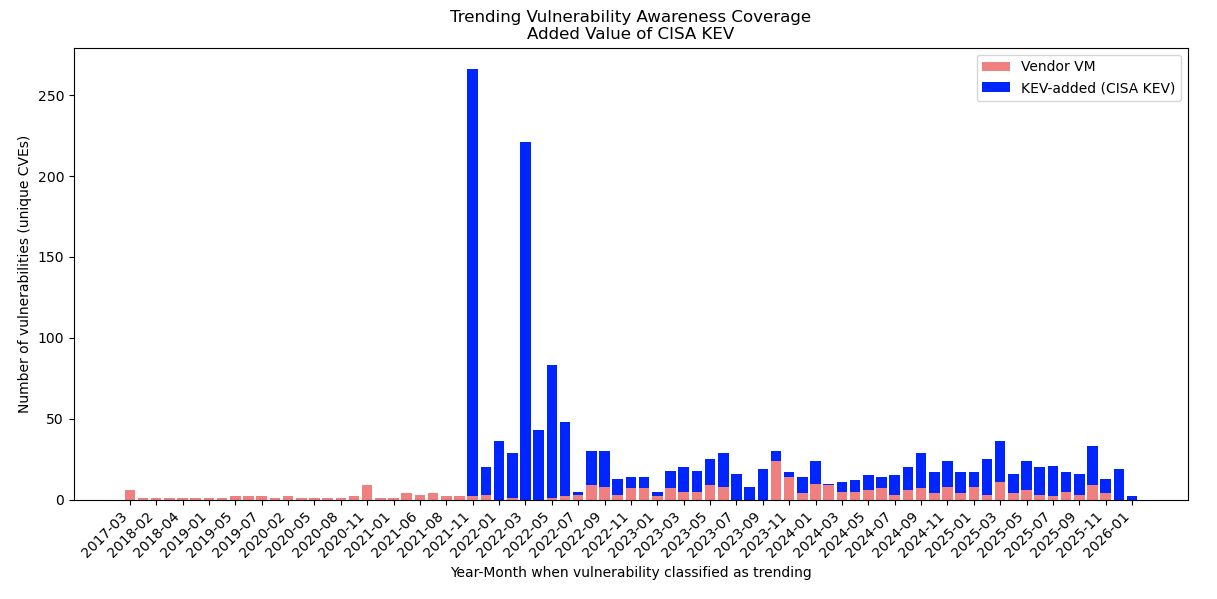
Trending Vulnerability Awareness Coverage is a metric indicating how many actively exploited vulnerabilities each source identified monthly:
Interpretation of Results:
- The blue segments (representing KEV-added vulnerabilities) consistently exceed the red segments (representing Vendor VM vulnerabilities) across most months. This indicates that CISA KEV identifies a significant portion of actively exploited vulnerabilities that are not captured by vendor VM platforms.
- After a peak period, KEV continues to contribute a stable number of additional vulnerabilities over time.
- Even in months when Vendor VM identifies actively exploited vulnerabilities, KEV consistently adds more exploited CVEs. This confirms that CISA KEV acts as an independent and authoritative signal for exploitation, rather than duplicating the intelligence provided by vendors.
Cumulative Trending Vulnerability Awareness Coverage is a metric that illustrates how many actively exploited vulnerabilities each source has accumulated over time:
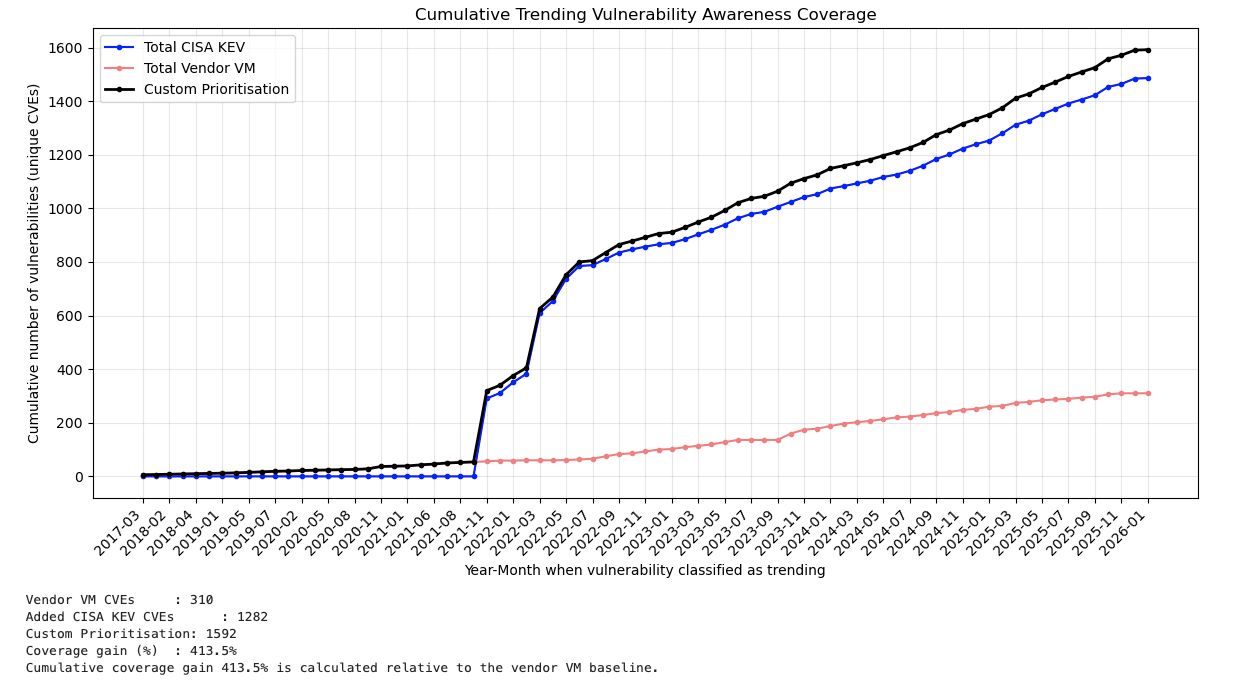
Custom Prioritization considers overlapping CVEs between CISA KEV and vendor sources while incorporating unique CVEs contributed by CISA KEV (+1,282 vulnerabilities).
Interpretation of Results:
- CISA KEV consistently identifies more actively exploited vulnerabilities than the vendor VM platform. The blue segments (Total CISA KEV) surpass the red segments (Total Vendor VM) in most months, indicating that a significant number of actively exploited vulnerabilities are identified through CISA KEV and are not included in the vendor-defined actively exploited signals.
- The value of KEV remains consistent over time, rather than being confined to peak periods. After the initial increase, KEV continues to reveal a steady number of additional exploited vulnerabilities, demonstrating its ongoing significance rather than reflecting a one-time alignment.
- KEV provides independent exploitation intelligence rather than duplicating vendor signals. Even during months when the vendor VM platform identifies actively exploited vulnerabilities, KEV consistently adds more CVEs that are already being exploited. This confirms that CISA KEV serves as an authoritative, independent exploitation signal instead of merely reflecting vendor intelligence.
Mean Time to Trending Classification (MTTC) refers to the average time it takes from the publication of a Common Vulnerabilities and Exposures (CVE) to the moment it is classified as actively exploited by a specific source.
-
The analysis included only those vulnerabilities that were present in both sources and had a known publication date. At the time of comparison, this intersection consisted of 171 CVEs.
-
It’s important to note that some vulnerabilities were published as early as 2017, before dedicated vulnerability catalogs became widely established. Therefore, the absolute MTTC values should be regarded as indicative rather than strictly precise.

This formula simplifies the metric’s interpretation: the lower the MTTC, the quicker a source identifies a vulnerability as actively exploited.
A shorter classification time directly enhances response speed to actual threats.
According to the aggregated results (measured in days), the integration demonstrates a clear impact: 69 days for the custom prioritization approach, 95 days for the vendor vulnerability management platform, and 169 days for CISA’s Known Exploited Vulnerabilities (KEV) list alone. By combining expertise from both sources, the overall classification time is reduced, leading to faster operational responses and more effective threat mitigation.
Conclusion
Integrating CISA KEV has led to an approximately 4.1 times (>400%) increase in awareness compared to a vendor-only approach.
This integration also achieves the fastest average time to classify vulnerabilities as actively exploited within the infrastructure by utilizing the earliest available exploitation signals from multiple sources.
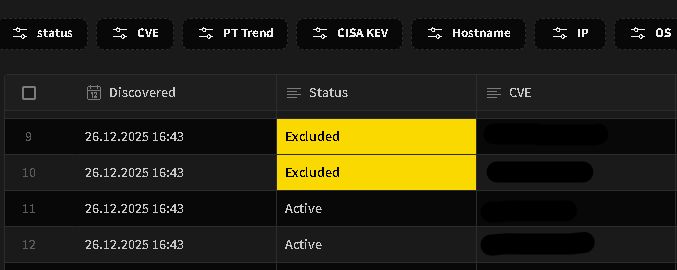
By creating a dedicated web dashboard, this integration improved our ability to detect, track, and reassess high-impact vulnerabilities over time. For instance, vulnerabilities that were previously excluded from remediation workflows may later be identified as actively exploited. This information allows us to re-evaluate their status and adjust remediation priorities accordingly. n
Integrating CISA KEV into a vulnerability management system offers an authoritative signal of real-world active exploitation, enhancing prioritization efforts. This signal is valuable not only for vulnerability management reporting but also for Security Operations Center (SOC) processes, including threat hunting and monitoring operational exposure.
Even if a commercial VM platform provides its own indicators of actively exploited vulnerabilities and related threat intelligence, CISA KEV can serve as an additional and independent source. This integration increases the coverage of exploited threats and strengthens the prioritization process, making it more robust and reliable.


