Table of Links
Abstract and 1 Introduction
1.1 The twincode platform
1.2 Pilot Studies
1.3 Other Gender Identities and 1.4 Structure of the Paper
2 Related Work
3 Original Study (Seville Dec, 2021) and 3.1 Participants
3.2 Experiment Execution
3.3 Factors (Independent Variables)
3.4 Response Variables (Dependent Variables)
3.5 Confounding Variables
3.6 Data Analysis
4 First Replication (Berkeley May, 2022)
4.1 Participants
4.2 Experiment Execution
4.3 Data Analysis
5 Discussion and Threats to Validity and 5.1 Operationalization of the Cause Construct — Treatment
5.2 Operationalization of the Effect Construct — Metrics
5.3 Sampling the Population — Participants
6 Conclusions and Future Work
6.1 Replication in Different Cultural Background
6.2 Using Chatbots as Partners and AI-based Utterance Coding
Datasets, Compliance with Ethical Standards, Acknowledgements, and References
A. Questionnaire #1 and #2 response items
B. Evolution of the twincode User Interface
C. User Interface of tag-a-chat
3.3 Factors (Independent Variables)
The four factors, i.e., independent variables, in both the original experiment and the replication are following.
group nominal factor representing the group (experimental or control) subjects were randomly allocated to.
time nominal factor representing the moment (t1 and t2) in which the first and second in-pair tasks were performed by the subjects.
ipgender nominal factor representing the induced partner’s binary gender (man or woman for the experimental group, and none for the control group) during the in-pair tasks.
gender nominal factor representing subject’s gender, which may be man, woman, or any other option as freely expressed in the demographic form during registration.


3.4 Response Variables (Dependent Variables)
The response variables, i.e., dependent variables, in both studies are described below, organized according to the corresponding three data sources—questionnaires, twincode platform, and chat utterance coding.
3.4.1 Perceived Variables (Questionnaires)
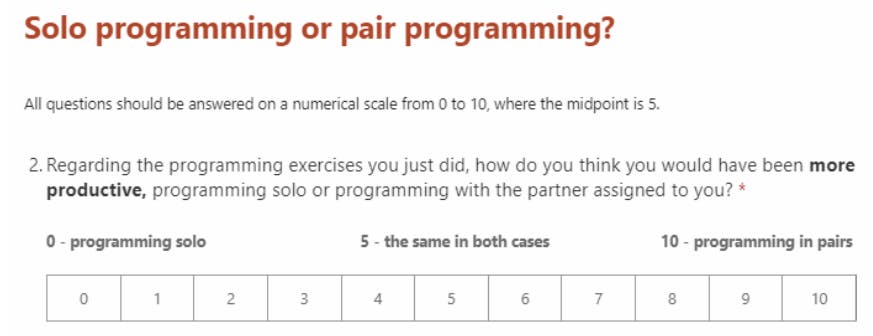
The response variables measuring subjects’ perception are mainly scales composed by four or more 0–10 linear numerical response items and they are computed as the average of their corresponding items. Following the recommendations by [29], the 0–10 items are labeled not only in the first and last points, but also in the midpoint (see Figure 5). They are described below.
pp interval variable composed of four 0–10 numerical response items (pp1…4) measuring the subject’s own perceived productivity during each pair programming task compared to solo programming (see RQ1). Low values correspond to better solo programming productivity whereas high values correspond to better pair programming productivity (see Figure 5 for an example of a response item and Section A.1 in the Appendix for all the response items in the scale).
pptc interval variable composed of four 0–10 numerical response items (pptc1…4) measuring the subject’s partner’s perceived technical competency compared to their own after each in-pair task (see RQ2). Low values correspond to higher subject’s productivity, whereas higher values correspond to higher partner’s productivity (see Section A.2 in the Appendix for all the response items).
ppa ratio variable counting the number of partner’s positive aspects identified by the subject after each in-pair task (see RQ3) [6] . This variable is automatically computed from an open question item in which subjects are asked to write the most positive and negative aspects of their partners in the previously performed pair programming exercise (see Section A.3 in the Appendix). They are instructed to prefix positive aspects with a plus sign (+) and negative ones with a minus sign (-). This variable is the result of automatically counting the number of plus signs in the text of the open question.
pna ratio variable counting the number of partner’s negative aspects identified by the subject after each in-pair task (see RQ3). In a similar way to the ppa variable, this variable is the result of automatically counting the number of minus signs in the text of the aforementioned open question (see also Section A.3 in the Appendix).
ppgender nominal variable measuring the perceived partner’s gender during the inpair tasks. To measure this variable, subjects are asked in questionnaire #3 whether they remember if their partners showed some avatars in chat windows or not. If the answer is no or I don’t remember (idr), this variable is assigned the none or idr levels at t1 and t2. If the answer is yes, then the subjects are asked for the avatars of the first and second partner, having man, woman, or idr as options, as shown in Figure 6.
cps interval variable composed of five 0–10 numerical response items (cps1…5) measuring whether the subject perceived better skills in their first or second partner in the in-pair tasks, i.e., compared partners’ skills (see RQ4). Low values correspond to the first partner, whereas high values correspond to the second partner (see Section A.4 in the Appendix for all the response items).
In the case of the experimental group only, this variable is transformed after collection in such a way that low values correspond to the partner for whom the induced gender was man, and high values to the partner for whom the induced gender was woman, in order to analyze whether there is a gender bias in the scoring.
3.4.2 Behavior-Related Variables (twincode Platform)


sca / sca_rf Ratio scale variables representing the count and relative frequency of characters added by a subject to the source code window during an in-pair task (source code additions).
scd / scd_rf Ratio scale variables representing the count and relative frequency of characters deleted by a subject from the source code window during an in-pair task. (source code deletions).
okv / okv_rf Ratio scale variables representing the count and relative frequency of successful (ok) validations of the source code performed by a subject during an in-pair task.


kov / kov_rf Ratio scale variables representing the count and relative frequency of unsuccessful (ko) validations of the source code performed by a subject during an in-pair task.
dm / dm_rf Ratio scale variables representing the count and relative frequency of dialog messages (chat utterances) sent by a subject during an in-pair task.
3.4.3 Communication-Related Variables (Utterance Tagging)
The chat utterances registered in the twincode platform during the in-pair tasks were manually tagged according to two orthogonal dimensions. The first dimension uses the 13 tags (from S to O in Table 1) proposed by [44]. The second dimension classifies each message as formal or informal, considering as formal the usual way in which a university student would communicate textually to a professor and informal otherwise.
For the tagging process, we followed a process inspired by the work of [42], in which two researchers each tagged 60% of the data, covering all dialogue messages. The overlapping subset of 20%, which was used for the initial training, established the inter-coder reliability using Cohen’s kappa, which was κ = 0.796 for the formal/informal tags, and κ = 0.754 for Rodr´ıguez et al tags, both indicating substantial agreement and sufficient reliability for further coding according to [55].
The response variables related to the manual tagging of the chat utterances (see RQ6 and RQ7) correspond to the tags in Table 1 and are listed below. Every variable represents a frequency, i.e., a count, and its associated relative frequency is computed with respect to the number of chat utterances generated by the subject during an in-pair task, which is defined by the dm variable specified in previous section.
i / i_rf Ratio scale variables representing the absolute and relative frequency of informal messages generated by a subject during an in-pair task.
f / f_rf Ratio scale variables representing the absolute and relative frequency of formal messages generated by a subject during an in-pair task.
s / s_rf Ratio scale variables representing the absolute and relative frequency of statement of information or explanation messages generated by a subject during an in-pair task.
u / u_rf Ratio scale variables representing the absolute and relative frequency of opinion or indication of uncertainty messages generated by a subject during an in-pair task.
d / d_rf Ratio scale variables representing the absolute and relative frequency of explicit or direct instruction messages generated by a subject during an in-pair task.
su / su_rf Ratio scale variables representing the absolute and relative frequency of polite or indirect instruction or suggestion messages generated by a subject during an in-pair task.
ack / ack_rf Ratio scale variables representing the absolute and relative frequency of acknowledgment messages generated by a subject during an in-pair task.
m / m_rf Ratio scale variables representing the absolute and relative frequency of meta–comment or reflection messages generated by a subject during an in-pair task.
qyn / qyn_rf Ratio scale variables representing the absolute and relative frequency of yes/no question messages generated by a subject during an in-pair task.
qwh / qwh_rf Ratio scale variables representing the absolute and relative frequency of wh- question (who, what, where, when, why, and how) messages generated by a subject during an in-pair task.
ayn / ayn_rf Ratio scale variables representing the absolute and relative frequency of answer to yes/no question messages generated by a subject during an in-pair task.
awh / awh_rf Ratio scale variables representing the absolute and relative frequency of answer to wh- question messages generated by a subject during an in-pair task.
fp / fp_rf Ratio scale variables representing the absolute and relative frequency of positive task feedback messages generated by a subject during an in-pair task.
fnon / fnon_rf Ratio scale variables representing the absolute and relative frequency of non–positive task feedback messages generated by a subject during an in-pair task.
o / o_rf Ratio scale variables representing the absolute and relative frequency of off– task messages generated by a subject during an in-pair task.
Authors:
(1) Amador Duran, I3US Institute, Universidad de Sevilla, Sevilla, Spain and SCORE Lab, Universidad de Sevilla, Sevilla, Spain ([email protected]);
(2) Pablo Fernandez, I3US Institute, Universidad de Sevilla, Sevilla, Spain and SCORE Lab, Universidad de Sevilla, Sevilla, Spain ([email protected]);
(3) Beatriz Bernardez, I3US Institute, Universidad de Sevilla, Sevilla, Spain and SCORE Lab, Universidad de Sevilla, Sevilla, Spain ([email protected]);
(4) Nathaniel Weinman, Computer Science Division, University of California, Berkeley, Berkeley, USA ([email protected]);
(5) Aslıhan Akalın, Computer Science Division, University of California, Berkeley, Berkeley, USA ([email protected]);
(6) Armando Fox, Computer Science Division, University of California, Berkeley, Berkeley, USA ([email protected]).
[6] According to the four scales of measurements introduced by [52], variables ppa and pna are defined as ratio variables because they are numerical variables in which zero represents a lack of the attribute (see Section 2.2 in [40] for an excellent explanation, or [22] for a graphical representation). Note that this is not the case for the pp, pptc, and cps interval variables, in which zero usually means “the same in both cases” or “both equally”.


