Table of Links
-
Abstract and Introduction
-
Domain and Task
2.1. Data sources and complexity
2.2. Task definition
-
Related Work
3.1. Text mining and NLP research overview
3.2. Text mining and NLP in industry use
3.3. Text mining and NLP for procurement
3.4. Conclusion from literature review
-
Proposed Methodology
4.1. Domain knowledge
4.2. Content extraction
4.3. Lot zoning
4.4. Lot item detection
4.5. Lot parsing
4.6. XML parsing, data joining, and risk indices development
-
Experiment and Demonstration
5.1. Component evaluation
5.2. System demonstration
-
Discussion
6.1. The ‘industry’ focus of the project
6.2. Data heterogeneity, multilingual and multi-task nature
6.3. The dilemma of algorithmic choices
6.4. The cost of training data
-
Conclusion, Acknowledgements, and References
5.2. System demonstration
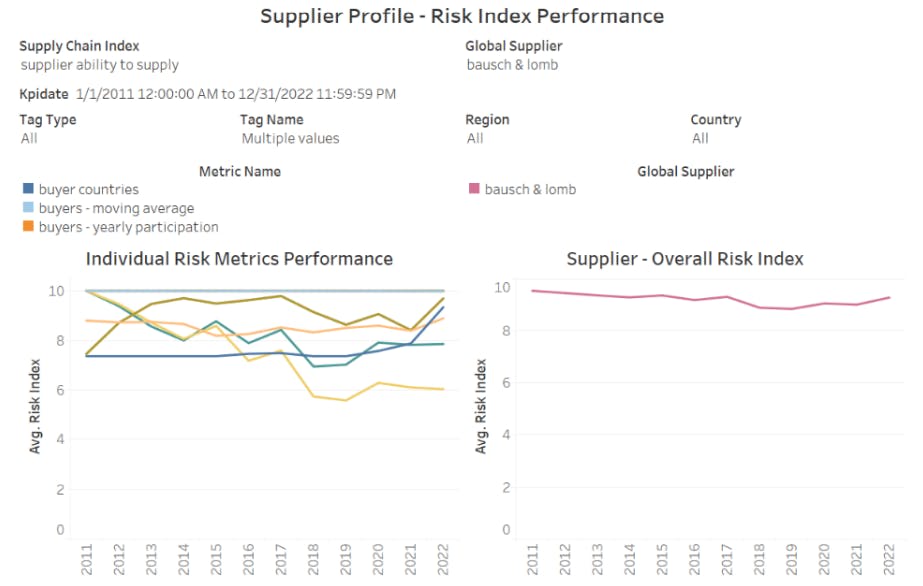
In this section, we present the end system to demonstrate the ‘supplier risk profiles’ in action. First, informed by the evaluation above, we retrained the best-performing model – random forest – using all the labelled datasets for each component in the pipeline. After retraining all models, we apply our workflow to the entire raw TED dataset. This contains roughly 3.3 million healthcare related tender notices (with contract awards) covering 2011 to 2022, involving over 167 thousands unique suppliers, 86 thousands buyers, with higher than $2 trillion in monetary value. Processing this massive dataset using our workflow explained above allowed us to create the biggest healthcare procurement database to date. We then run queries to obtain data from the database to calculate the above-mentioned metrics for each supplier. We show a few examples in screenshots below.
Figure 8 shows the supplier risk profile in terms of ‘ability to supply’ and ‘economic risk’ for Bausch & Lomb, based on their contracts won between 2011 and 2022. The line chart on the left shows a number of ‘buyer’ metrics (BM) selected for review, such as: ‘buyer countries’ that measures a supplier’s global reach by considering countries they won contract in; ‘buyers – moving average’ that considers the number of active buyers for a supplier; and ‘buyers – yearly participation’ that considers the number of active buyers for supplier each year. The line chart on the right aggregates these selected metrics to show an overall trend. Figure 9 shows the supplier risk profile (also ‘ability to supply’ and ‘economic risk’) for Siemens covering the same time period, but using a mixture of ‘lot’ and ‘buyer’ metrics (LM and BM). For example, ‘buyer – churn/retention rate’ that measures the change in the supplier’s clients (based on the number of new buyers they had and lost during each time period); ‘lots – average duration days’ and ‘lots – duration days’ looking at lot duration in days to understand lot delivery time frames. Each figure demonstrates risks of a specific supplier from different perspectives, hence allowing users to thoroughly evaluate a supplier.
Figure 10 and 11 compare global suppliers in a single view. Generally, a straight line with little fluctuations is desirable as that indicates little change in risks over time. We can notice that in Figure 10, most suppliers selected for review have relatively little change in terms of their risks. This is mainly due to them being large, established suppliers that tend to win a continuous stream of contracts over time. However, some suppliers had more fluctuations in their risk indices compared to others, suggesting they may be riskier choices to buyers. Figure 11 compares several smaller suppliers, and we can see that their risk patterns are much more erratic, due to a lack of continuity in their track record.
Authors:
(1) Ziqi Zhang*, Information School, the University of Sheffield, Regent Court, Sheffield, UKS1 4DP ([email protected]);
(2) Tomas Jasaitis, Vamstar Ltd., London ([email protected]);
(3) Richard Freeman, Vamstar Ltd., London ([email protected]);
(4) Rowida Alfrjani, Information School, the University of Sheffield, Regent Court, Sheffield, UKS1 4DP ([email protected]);
(5) Adam Funk, Information School, the University of Sheffield, Regent Court, Sheffield, UKS1 4DP ([email protected]).


