
At the beginning of each year, as is our tradition, we team up with Enterprise Technology Research to dig through the latest data and craft 10 predictions for the coming year.
This year’s prognostication follows the publication where we grade our 2025 predictions. In this Breaking Analysis, we tap some of the most telling nuggets from ETR’s rich data set and put forth our top 10 predictions for enterprise tech in 2025.
Most of the predictions below are backed up with data based on proprietary market intelligence from ETR’s Technology Spending Intentions Survey (TSIS) and its quarterly macro drill-down data, which surveys more than 1,700 business technology leaders.
The industry speaks
Each year we get thousands of inbound predictions from tech companies and thought leaders. We go through each one and categorize them. Every year the folder gets larger. In the graphic below we show the mix of topic areas. Of course everything is artificial intelligence, but we’ve tried to isolate those that were AI-specific. As always, security is top of mind for forecasters, as you can see with 25% of the inbounds.
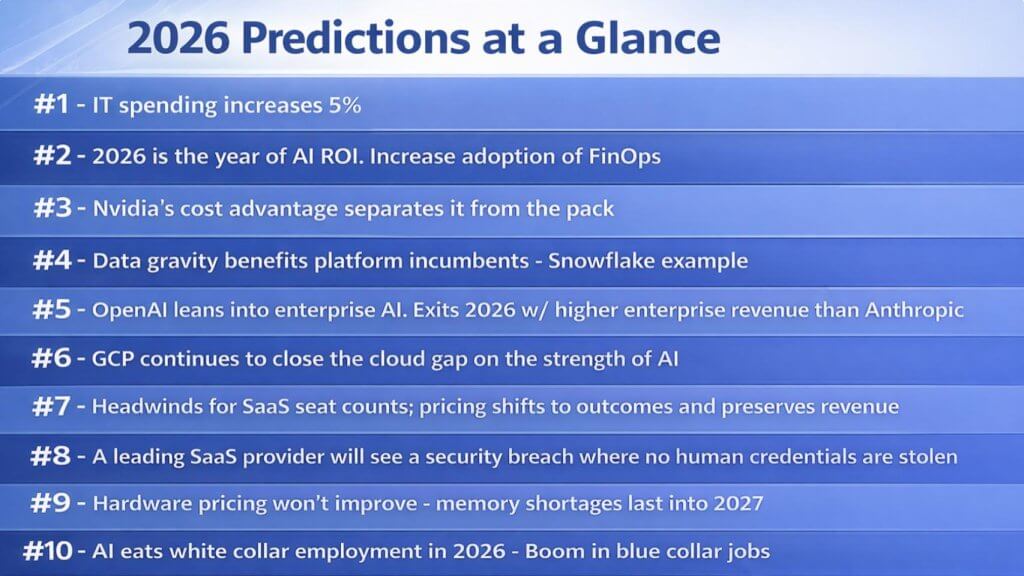
Ten predictions for 2026
Our predictions this year span information technology spending, AI return on investment, Nvidia Corp.’s moat, data, large language models, cloud, changes to the software-as-a-service model, security, hardware pricing and the memory shortag, and the impact of AI on jobs.
Let’s dive into the detail.
Prediction No. 1 – IT spending increases 5%
The first prediction is: IT budgets rise about 5% in 2026. Since COVID, organizations have dealt with sustained pressure on IT budgets as interest rates rose and uncertainty dominated. Geopolitical tensions, wars, tariffs and related shocks have kept decision-makers cautious. Against that backdrop, ETR’s quarterly macro drill-down shows IT decision makers currently expecting a 4.6% budget increase. The call at 5% is a modest step above the mean, with notable divergence in large enterprises – they remain more conservative at under 4% – while the C-suite and Asia-Pacific respondents are more optimistic.
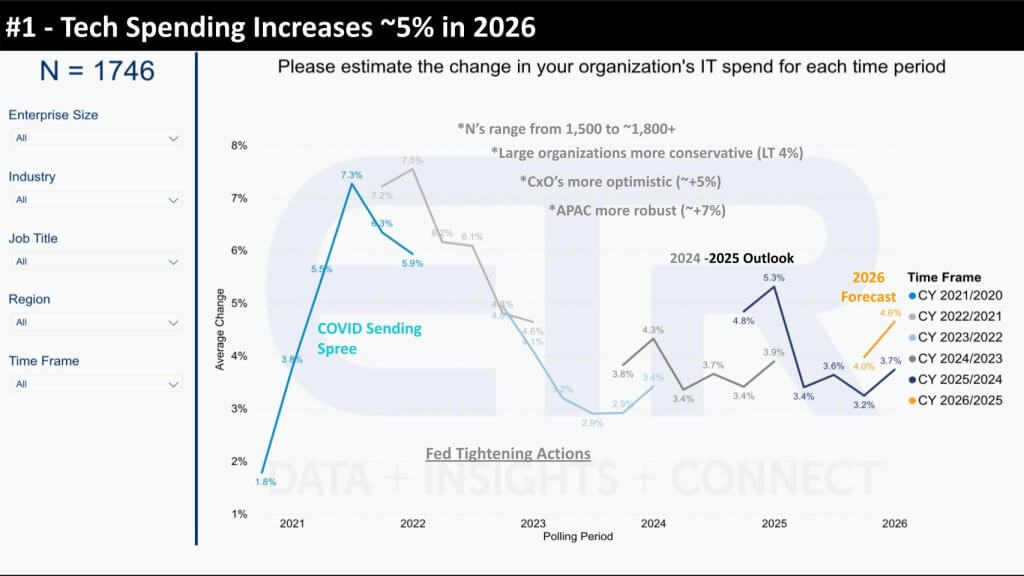
The data is moving in the right direction. The forward spending outlook has improved meaningfully versus earlier surveys, with a notable jump from the first October survey when respondents were asked for the first time about forward spend into January. In the current survey, 74% of respondents indicate they plan to increase spending, the highest level since January 2022. This suggests the optimism is not isolated to a single segment.
The large-enterprise caution is a concern, however, but even within the Fortune 500, the trend is improving, rising by more than a percentage point survey-over-survey. The C-suite cut comes in above the mean at 5.2%, reinforcing that senior leadership sentiment is leaning more aggressively toward growth than the broader population.
An important nuance is what this metric represents. This is IT budget data – not vendor revenue. It includes staffing and related internal costs and should not be conflated with market forecasts from firms such as IDC and Gartner forecasting vendor revenue growth. Over time, budgets are likely to evolve as the data center buildout expands access to token-based services and as organizations scale up with less headcount. Staffing is one of the largest line items in IT budgets, and AI-driven productivity and automation will influence that mix going forward. The near-term focus, however, is the 2026 budget direction of roughly 5%, reflected in the survey.
Key takeaways
- ETR’s survey data points to a 4.6% expected increase in IT budgets, with 5% a reasonable increase given recent upward movement.
- 74% of respondents plan to increase spending, the highest level since January 2022, suggesting broad-based improvement.
- Large enterprises remain the most conservative cohort, but the Fortune 500 improved by more than a point survey-over-survey.
- The C-suite is more optimistic at 5.2%, supporting the case for a slightly better-than-average outcome in our prediction.
- This is IT budget data (including staffing), not vendor revenue, and it will shift over time as token consumption and productivity dynamics reshape spend mix.
Prediction No. 2: 2026 is the year of AI ROI
The second prediction is that 2026 becomes the year enterprises start seeing AI ROI at scale. In prior years, our prediction was that ROI would remain elusive. The data is now moving in a different direction, with signs of a productivity increasing and more evidence that enterprises are beginning to operationalize AI in ways that sustain returns.
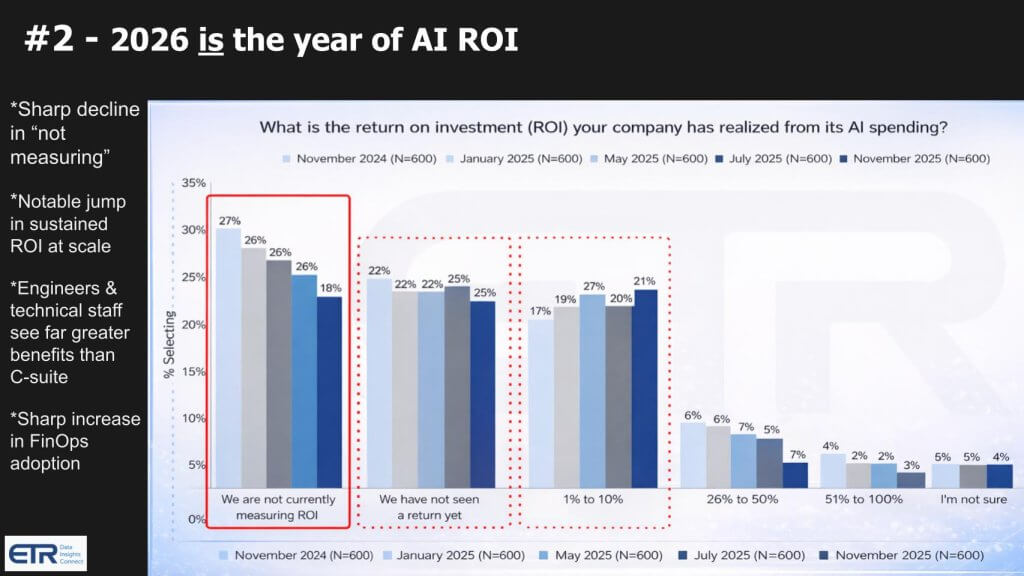
The ROI story is aligning around two themes: 1) Measurement discipline and 2) Scaling outcomes. Early in the cycle, organizations were spending heavily while a large portion of the market either was not measuring ROI or had not seen any return. In November 2024, combining “not measuring ROI” with “had not seen ROI” put the total near 50%, a concerning gap between investment intensity and financial confidence.
That gap is narrowing. The most important shift is that more organizations are measuring ROI. The share that is not measuring dropped from 27% to 18%, and a rise in financial-operations adoption in the ETR data signals that enterprises are putting cost controls and accountability structures around AI spending. Six to eight months ago, FinOps barely surfaced in insights panels and interviews. Now it is showing up constantly, which tracks with a market moving from experimentation to governance and operational rigor.
The data also shows incremental improvement in realized ROI bands. The 1% to 10% ROI bucket has fluctuated but has steadily increased since November 2024. That supports the view that organizations are beginning to realize returns and are learning how to align AI initiatives with measurable outcomes.
A key nuance is what enterprises expect ROI to be. In the ETR AI series data, 66% of respondents say AI ROI comes from cost efficiency and margin improvement. Only 23% expect ROI to come from revenue growth or new product creation. That distribution is relevant because it explains why FinOps is rising and why measurement is becoming central. If most ROI is expected to come from margin and efficiency, auditing and control of usage and spend becomes a prerequisite for declaring success.
Key takeaways
- In November 2024, nearly half of organizations were either not measuring AI ROI or had not seen any, despite heavy spending.
- The share not measuring ROI dropped from 27% to 18%, showing a meaningful step-up in measurement discipline.
- FinOps is becoming a constant topic, reflecting a shift from experimentation to operational control of AI spend.
- The 1% to 10% ROI category has steadily increased since late 2024, suggesting rising realization of returns.
- 66% of respondents link AI ROI to cost efficiency and margin improvement, while 23% expect revenue growth or new product creation.
Prediction No. 3: Nvidia further separates from the pack on cost per token
The third prediction comes out of research published earlier this month following Nvidia Chief Executive Jensen Huang’s keynote at CES. The call is that Nvidia widens its lead over the broader graphics processing unit/tensor processing unit/application-specific integrated circuit pack because its cost per token advantage improves materially in 2026.
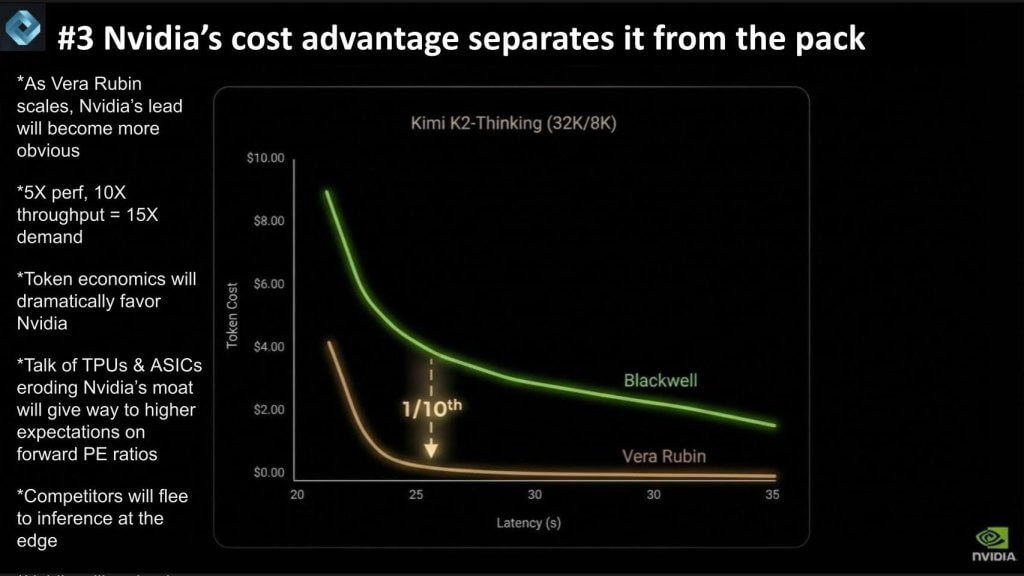
A key factor is Nvidia’s CES disclosure that its latest GPU Vera Rubin is in full production and will ramp this year. The data shared at CES pointed to a rapid step-function improvement over Blackwell delivered in roughly 12 months: 5X performance, 10X throughput, and a 10X improvement in token cost. That combination of higher output and far lower unit costs is expected to drive a significant uptake in demand.
The demand premise is based on Jevons Paradox – as price declines, consumption rises – and the prediction is that the cost-per-token reduction contributes to a 15X increase in demand. Against that backdrop, we expect the narrative that TPUs and ASICs are eroding Nvidia’s moat will itself erode, and the expectation is that Nvidia’s financial metrics will will reflect the magnitude of this advantage. Nvidia’s price-to-earnings ratio is hovering in the mid-20s – even lower than Walmart – and that multiple increases as investors internalize the sustainability of Nvidia’s position. It’s possible and even likely that some GPU designers will pivot to edge use cases or cancel programs.
Looking ahead, our expectation is that Nvidia faces effectively no competition in the data center except where demand cannot be met. That unmet demand supports alternatives, but the path for competitors goes through inference and workloads at the edge. Our view is that Nvidia also performs well at the edge, with the addition of a lock-up a deal with Groq.
Demand continues to outstrip supply, which means suppliers broadly sell what they can ship. The implication is that the best news for competitors is the current “rising tide” environment lifts all chip boats, and suppliers have little incentive to see that dynamic change soon.
Key takeaways
- Vera Rubin is in full production and ramps in 2026, with Nvidia citing 5X performance, 10X throughput, and 10X better token cost versus Blackwell.
- The cost-per-token reduction is expected to drive a 15X demand increase, consistent with Jevons Paradox dynamics.
- Nvidia’s valuation is not fully reflecting the advantage, with a PE in the mid-20s cited as a setup for multiple expansion.
- Data center competition is constrained primarily by supply shortages, while competitors seek footholds in inference and edge workloads.
- Demand exceeding supply supports a rising tide environment where all suppliers sell what they have.
Prediction No. 4: Data gravity benefits platform incumbents – a Snowflake example
We believe data gravity increasingly benefits database platform incumbents as enterprises build AI capabilities on top of their existing ecosystems. Using Snowflake Inc. as an example, the data suggests that add-on services to a core data platform – like Cortex – become a natural extension of the underlying database. The core platform remains sticky, and that stickiness increases as customers pull adjacent workloads into the same ecosystem. In our view, this dynamic extends beyond Snowflake to other major incumbents, including Databricks Inc., Oracle Corp. and Microsoft Corp.
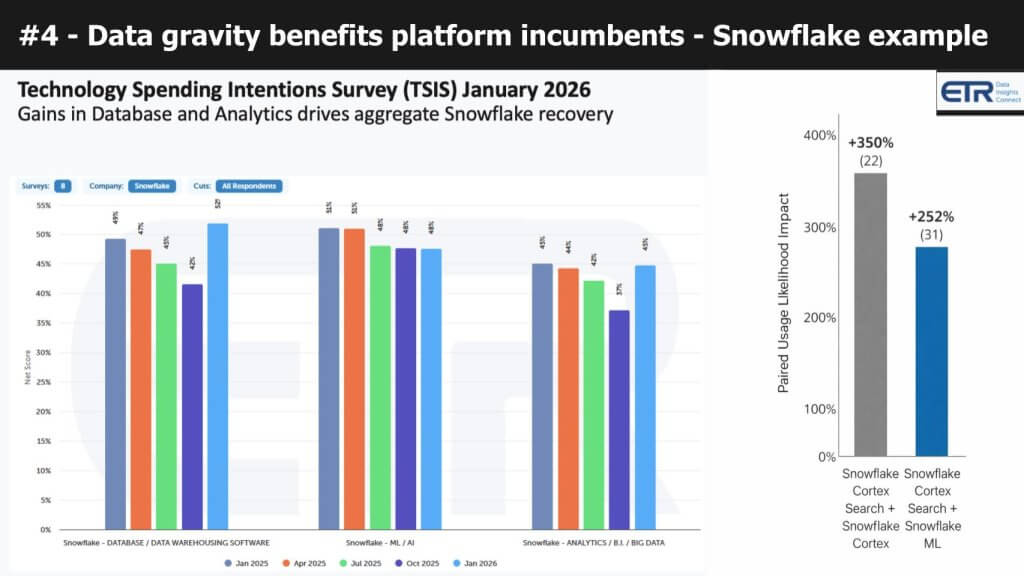
This chart above has two parts that reinforce the prediction. Specifically, when teams build AI applications, they tend to stay close to the database ecosystem where their data already lives – and that shows up in spending intentions.
Starting on the right-hand graphic: This comes from ETR’s build-versus-buy AI series and looks only at respondents who say they are building their own AI applications. The y-axis is Paired Usage Likelihood Impact, which is a way of showing how strongly two components show up together in the same tech stack. Using Snowflake as the clearest example in this cut, the chart shows that when customers adopt Snowflake Cortex Search, they are far more likely to adopt additional Snowflake components. Specifically:
- Snowflake Cortex Search + Snowflake Cortex shows a +350% paired likelihood impact (n = 22).
- Snowflake Cortex Search + Snowflake ML shows a +252% paired likelihood impact (n = 31).
In our view, this is the data gravity effect in practice. Once a customer is anchored in a Snowflake-led workflow for one element of the AI stack, the probability increases that adjacent elements – search, vector search or vector database style capabilities, and model-related components – remain inside the same ecosystem.
Now move to the left-hand graphic: This is from ETR’s Technology Spending Intentions Survey and shows Snowflake Net Score (spending momentum) trends over time across three categories that relate to this prediction:
- Database/Data Warehousing Software
- ML/AI
- Analytics/BI/Big Data
Each cluster shows snapshots over five time points spanning from Jan 2025 to Jan 2026. The chart headline says it all: “Gains in Database and Analytics drives aggregate Snowflake recovery.” The data suggests a meaningful rebound in Snowflake’s core database and analytics momentum showing up in 2026, with Database/Data Warehousing notably jumping back up versus the prior quarters, and Analytics showing a similar recovery pattern. ML/AI remains elevated but comparatively steadier across the period.
The bottom line is that we see a pull toward the incumbent’s database ecosystem when organizations are building their own AI applications. Snowflake is the clearest example in this dataset. When customers are using Snowflake for one layer of their stack, they are more likely to stay in the Snowflake ecosystem for adjacent capabilities including search, vector search, vector database and foundational model usage combined with other stack elements.
This in our view highlights the predictive value of the ETR dataset as a leading indicator. In prior market shifts, Breaking Analysis observed survey data that flagged early movement, including the work-from-home wave and its impact on vendors such as CrowdStrike Holdings Inc., Okta Inc. and Zscaler Inc. We have seen similar leading signals in the rise of Snowflake and Databricks, periods of softening that preceded market repricing and subsequent rebounds. The data suggests the current resurgence is part of that same pattern of early signal preceding broader market recognition.
Key takeaways
- We believe data gravity is pulling AI workloads toward existing database ecosystems, reinforcing incumbent platforms.
- The data suggests customers anchored on Snowflake are more likely to adopt adjacent stack components within the Snowflake ecosystem, including search, vector search, vector database and related model-layer integrations.
- Snowflake’s platform pull-through is translating into a sharp rebound in core database and data warehousing spend intent, pushing it to the top public company NetScore in ETR’s full dataset.
The message is that platform incumbency is compounding in the sense that as enterprises build AI applications, they consolidate more of the stack around the database ecosystem they already trust, and the data suggests Snowflake is currently the clearest beneficiary of that gravity with a measurable resurgence in spending intent.
Prediction No. 5: Leading LLMs shift focus to enterprise AI
We believe 2026 is the inflection year where leading model providers optimize around enterprise adoption, not just model benchmarks and consumer buzz. Our bet is that OpenAI follows Anthropic’s enterprise posture more aggressively, uses consumer scale as leverage, and exits 2026 with enterprise revenue that surpasses Anthropic’s. In parallel, we expect OpenAI to pressure Google’s search economics, and we expect Elon Musk’s Grok to pursue edge-oriented opportunities where he already has a strategic footprint.
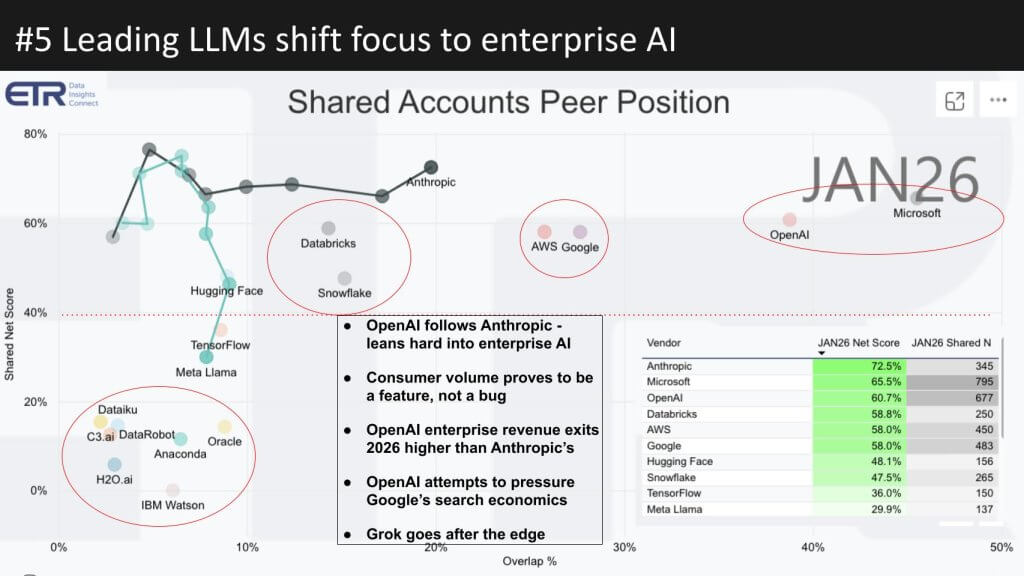
The chart above shows where model and AI platforms sit inside enterprise accounts today, using two dimensions from ETR’s TSIS.
First, read the plots. Each dot is a vendor. The x-axis is Overlap %, which we use here as a proxy for pervasion and account penetration across the dataset. The y-axis is Shared Net Score, which represents spending momentum among the accounts where the vendor is present. The red dotted line at 40% is the “highly elevated momentum” threshold.
The upper-right corner is the power position indicating high penetration and high momentum. That is where Microsoft and OpenAI Group PBC sit in the January 2026 survey and have for some time. Amazon Web Services Inc. and Google LLC are clustered close together in the upper-middle portion, reflecting strong momentum and meaningful overlap. Databricks and Snowflake sit near one another as well, which fits our prior prediction on data gravity and platform pull-through. Anthropic PBC is high on the y-axis with strong momentum, sitting above the red line with notable progress since last year. Meta Platforms Inc.’s Llama is well below the threshold and has fallen out of the leadership conversation in this dataset (and the market) relative to the leaders. In the lower-left are the legacy machine learning and AI players fighting for relevance on both overlap and momentum.
Second, use the table on the right to anchor the scatter with exact numbers. For JAN26 Shared Net Score and Shared N, Anthropic leads at 72.5% (345), followed by Microsoft at 65.5% (795) and OpenAI at 60.7% (677). Databricks comes in at 58.8% (250). AWS and Google are tied at 58.0% with Shared N of 450 and 483, respectively. Snowflake is at 47.5% (265) and Meta Llama at 29.9% (137).
Pervasion on the x-axis is the leading indicator to watch as this shifts from experimentation to enterprise standardization. OpenAI is already near 40% pervasion versus Anthropic at roughly 20%, while most other players remain in single digits. Anthropic doubled pervasion from about 10% to 20% in a year, but OpenAI’s starting position is meaningfully more entrenched inside enterprise environments.
That penetration advantage is relevant to our prediction because we believe it makes the consumer volume a feature for enterprise, not a bug. OpenAI’s distribution, usage patterns and familiar interface create gravity that increasingly supports enterprise use cases and API-driven deployments. Recent data suggests that OpenAI’s API added more than $1 billion in annualized revenue run rate last month alone, which reflects enterprise-driven revenue generation and evidence the platform is moving beyond a consumer chatbot phase. In our view, once that enterprise flywheel starts spinning, it continues to gain momentum.
On Google, our prediction extends beyond model performance, where Gemini has made truly impressive strides. We believe OpenAI’s recent moves around advertising are aimed at pressuring Google’s core economics. Search queries cost fractions of pennies, AI queries are far more expensive (100X), and we expect OpenAI to keep testing ways to insert itself and disrupt Google’s advertising economics. Though Microsoft’s earlier attempts to AI-ify Bing did not deliver the intended results, we believe OpenAI’s scale and positioning give it a better chance.
On Grok, we expect a push to the edge. Elon had explored designing a data center GPU, then backed away from that path as Nvidia’s lead became more obvious. At the same time, Tesla Inc. already operates with an edge-oriented chip design capability built around Arm and customized neural processing units, or NPUs, for vehicles. We believe Grok strengthens that position, with continued silicon innovation focused at the edge while xAI Holdings Corp. scales data center capacity rapidly in Memphis – with a high priority position in Nvidia’s allocation queue.
Longer-term, theCUBE Research work by George Gilbert and David Floyer suggests that leading LLM companies could evolve into a new breed of software delivered through application programming interfaces, making adoption easier for enterprises without deep engineering chops. We do not expect that full transformation to be obvious in 2026, but we believe it ties directly to the multiyear shift from legacy IT spend toward token generation and more AI-ified operating models.
Key takeaways
- We believe OpenAI follows Anthropic’s enterprise lead and exits 2026 with enterprise revenue above Anthropic’s, supported by stronger pervasion in ETR’s data.
- The chart positions Microsoft and OpenAI in the upper-right, with broad penetration and elevated momentum, while Anthropic leads momentum and continues to gain pervasion rapidly.
- OpenAI’s pervasion in the ETR data is near 40% versus Anthropic near 20%, and we note OpenAI API added more than $1 billion in ARR last month alone.
- We expect OpenAI to apply pressure to Google’s search economics via advertising moves, while Grok pushes edge opportunities tied to Elon’s silicon expertise born at Tesla.
The message is that enterprise penetration and spending momentum are converging around a small set of leaders, and the data suggests OpenAI has the distribution advantage to translate consumer scale into enterprise-standard deployments, with Anthropic setting the pace on momentum, and Google and AWS clustered tightly – Google having the advantage in proprietary models — and Grok positioning for edge-driven differentiation over time.
Prediction No. 6: Google Cloud continues to close the gap on AWS and Azure
We believe Google Cloud Platform continues closing the gap on AWS and Azure in 2026, driven primarily by its prowess in AI, reinforced by a world-class data foundation, and supported by improving profitability. As shown below, while GCP still trails in enterprise penetration, the leading indicators in spending intent suggest momentum is shifting in Google’s favor, particularly inside large enterprises.
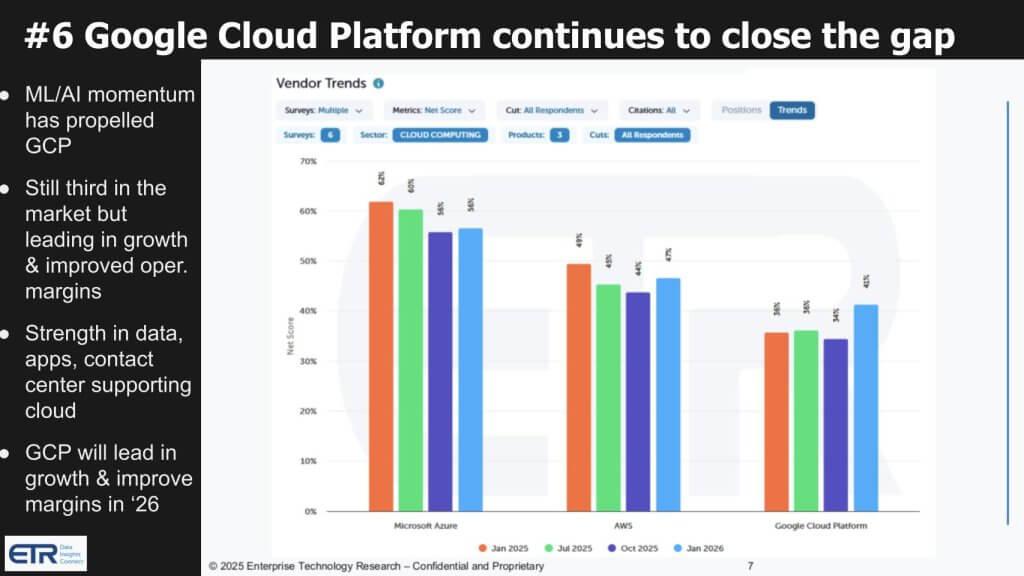
Google Cloud Platform is showing sustained momentum. The starting point is growth and operating leverage. By our estimates, GCP grew roughly 40% last quarter. Alphabet discloses Google Cloud overall rather than GCP specifically, but we believe GCP is growing meaningfully faster than the consolidated cloud segment. At the same time, Google Cloud operating margins have moved into the black and are now in the mid-20s, and moving in a direction we see as increasingly encouraging for a scaled cloud business. In our opinion, those margins continue to expand as the business matures, and that translates into meaningful cash generation over time.
The ETR data above reinforces the momentum. In the core spending intent datasets, GCP is the only one of the Big Three cloud providers showing year-over-year Net Score acceleration, while AWS and Azure both declined. Penetration remains lower – pervasion trails those two, particularly versus Azure – but the direction of spend intent is moving up.
The spending intent improvements are not confined to smaller accounts. The increase shows up in Fortune 100, Fortune 500 and Global 2000 cohorts, which historically have been harder for Google to penetrate. We believe that shift reflects Google’s broader enterprise prowess – more credibility with the largest organizations and more proof points that GCP can run mission-critical workloads at scale.
ETR’s AI series data provides more evidence to explain why this is happening now. We see rising usage across Google’s AI build stack, including Gemini and Vertex AI, with gains survey over survey. In our view, Google’s positioning as both a foundational model provider and a cloud hosting platform is becoming more integrated, and that integration is beginning to show up in customer behavior.
We also believe Google’s approach has benefited from patience. The company has the capital to play a longer game. As operating margins climb toward the levels sustained by AWS over many quarters – and as Azure continues to benefit from software contribution – we expect Google to keep expanding profitability while it builds share. That is the combination that changes perception with accelerating demand plus improving margins.
Key takeaways
- We believe GCP continues closing the gap on AWS and Azure, driven by AI momentum and a strong data foundation.
- By our estimates, GCP grew roughly 40% last quarter, and Google Cloud operating margins are now in the mid-20s with room to expand.
- The data suggests GCP is the only Big Three cloud provider with year-over-year Net Score acceleration, while AWS and Azure declined.
- Spend intent is rising across Fortune 100, Fortune 500, and Global 2000 cohorts, indicating traction in the largest enterprises.
- AI stack adoption is increasing across Gemini and Vertex AI, reinforcing GCP’s momentum as both model provider and cloud platform.
The message is that Google’s cloud business is entering a new phase where AI-led demand, improving enterprise traction and expanding operating margins work together, and the survey data suggests GCP is the only Big Three provider accelerating on Net Score while extending its relevance with the largest global organizations.
Prediction No. 7: Headwinds for SaaS seats, but software vendors preserve revenue
We believe 2026 marks a transition year for software-as-a-service monetization. Seat-based pricing has been misaligned with customer value for a long time, and AI amplifies that tension by changing how work gets done and how many users need direct licenses. At the same time, SaaS vendors have deep entrenchment in enterprise process logic and trusted data, and in our view that gives them leverage to preserve and grow revenue even as seat growth moderates. The prediction is not a SaaS collapse. The prediction is that pricing evolves, with a shift toward outcome-based and AI-inclusive monetization showing up in the numbers.
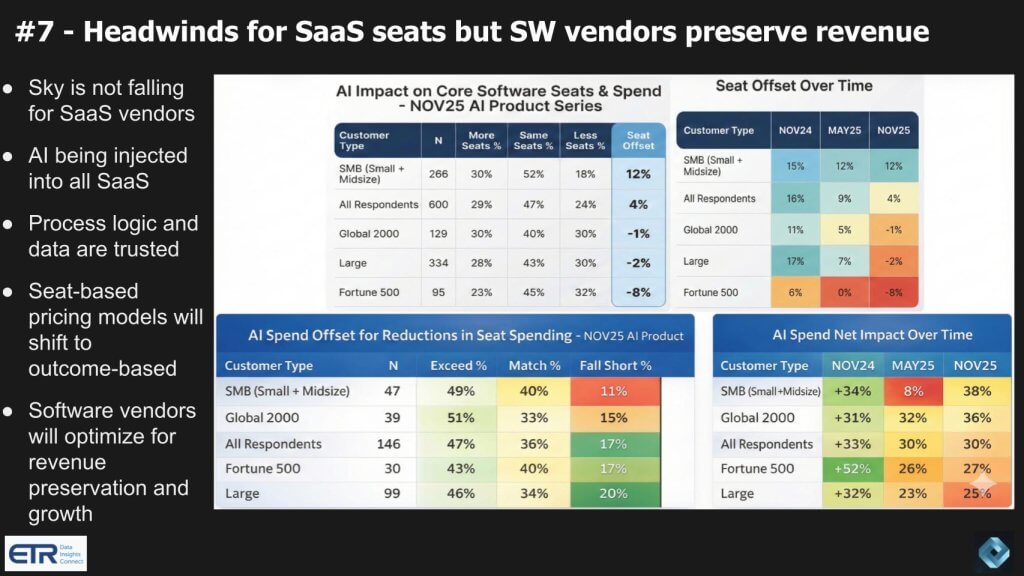
The graphic above is a two-parter designed to answer the question “Does AI reduce SaaS seats, and if it does, does revenue fall with it?” The top row focuses on seats. The bottom row focuses on spend offsets.
Start with the top-left table: “AI Impact on Core Software Seats – NOV25 AI Product Series.” It breaks results by customer type and shows the percentage expecting more seats versus same seats versus less seats, then summarizes the net “seat offset.” The seat offset is positive for small and medium-sized businesses (+12%) and modestly positive for the total sample (+4%). It turns negative as you move upmarket to the Global 2000 (-1%), Large (-2%) and Fortune 500 (-8%). The message is that the biggest organizations are the ones most likely to see seat pressure.
Now look to the top-right table: “Seat Offset Over Time.” It shows how that seat offset is trending from NOV24 to MAY25 to NOV25. The direction is consistent in that net seat impact is moving down over time, especially in larger cohorts. Global 2000 moves from +11% to +5% to -1%, and Large moves from +17% to +7% to -2%. Fortune 500 shifts from +6% to 0% to -8%. Seat growth is moderating, and in large enterprises it is flipping negative.
Now move to the bottom-left table: “AI Spend Offset for Reductions in Seat Spending – NOV25 AI Product Series.” This is the follow-up question asking even if seats decline, does AI-related spend compensate? Respondents are asked whether AI spend will exceed, match, or fall short of any reduction in seat spend. In the Global 2000 row, 51% say AI spend exceeds the seat reduction, 33% say it matches, and 15% say it falls short. That pattern indicates monetization moving from seats toward AI and outcomes.
Finally, bolster the conclusion with the bottom-right table: “AI Spend Net Impact Over Time.” This compresses the prior view into a single net impact metric over time. In NOV25, SMB shows 38%, Global 2000 shows 36%, and All Respondents shows 30%. Fortune 500 and Large are lower at 27% and 25% respectively, but still positive. Even in cohorts where seat offsets are negative, the net spend impact remains meaningfully positive.
This is why we believe the market’s “SaaS is dead” and the “SaaS-Attack” narrative is overstated. Seat counts can be pressured while revenue grows if vendors successfully reprice around AI, usage and outcomes. We also believe the public commentary from large SaaS vendors aligns with this dynamic. Specifically, customers are asking for help operationalizing AI, and vendors are embedding AI into the products where data, metadata and business process logic already live.
Key takeaways
- The data suggests seat growth is slowing and turning negative in larger enterprises, with NOV25 seat offsets of -1% (Global 2000), -2% (Large) and -8% (Fortune 500).
- Seat offsets have deteriorated over time, with Global 2000 moving from +11% (NOV24) to -1% (NOV25), and Fortune 500 moving from +6% to -8% over the same period.
- The spend offset data shows AI monetization compensating for seat reductions, with 51% of Global 2000 respondents saying AI spend exceeds the seat reduction.
- Net spend impact remains strongly positive in NOV25, including 36% for Global 2000 and 30% overall, supporting the view that vendors preserve revenue while pricing evolves.
The message is that AI creates real headwinds for SaaS seat expansion, especially in the largest enterprises, but the spend data suggests SaaS vendors preserve and grow revenue by shifting monetization toward AI, usage and outcomes – a pricing evolution, not a SaaS collapse.
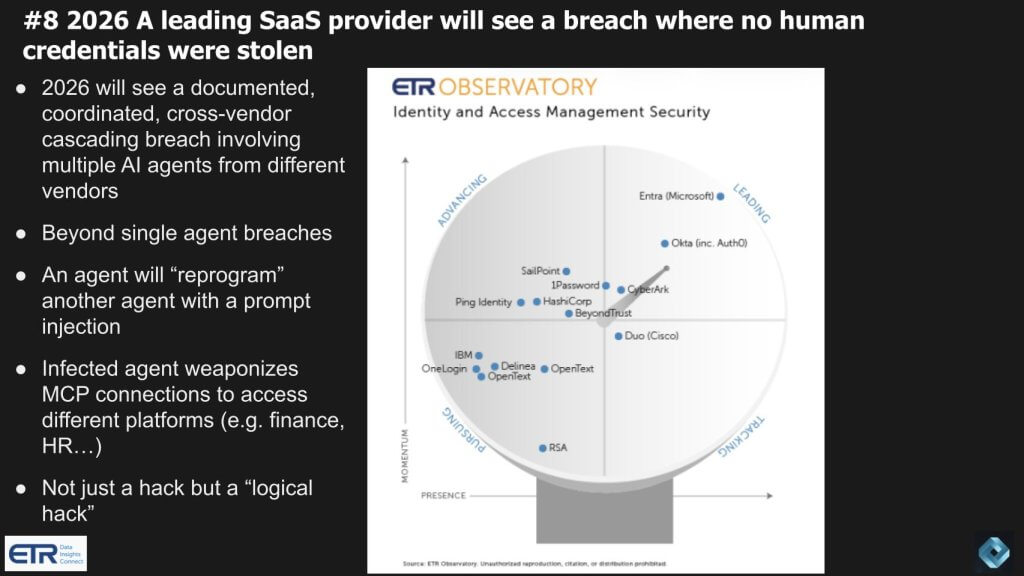
Prediction No. 8: A leading SaaS provider suffers an agent-driven breach with no stolen human credentials
We believe 2026 produces a new class of breach that most security teams are not prepared to contain — specifically, a major SaaS incident where no human credentials are stolen. Additionally, the attack vector is agentic, coordinated across multiple SaaS platforms, and executed by multiple AI agents from different vendors. The novelty is a logic hack, not a credential hack, set off by a prompt injection or agent-to-agent manipulation that redirects an agent’s behavior, spreads laterally via trusted integrations, and moves at machine speed across the digital supply chain.
This prediction builds on a related warning from one of our inbounds that came from Shahar Man, CEO and co- founder of Backslash Security. In November 2025, he predicted, “A major MCP breach will define the AI coding threat model – We’ll see in 2026, the first large- scale breach originating from MCP.” What we saw with the Anthropic hack was related and supported the direction of Shahar’s prediction.
We’re building on that prediction and expecting something broader. The breach we are forecasting involves one agent reprogramming another through prompt injection, then using MCP connections across SaaS platforms to jump domains – finance, HR, supply chain – potentially spanning multiple vendors and even multiple companies. In our view, agents become bridgeheads meaning once a nonhuman identity is granted access and can influence adjacent agents, the blast radius expands quickly. Some are referring to this as a polyagent breach, where the infection doesn’t just stay in one system.
The security implication is disconcerting. Antivirus is blind to this class of attack because there is no traditional malware signature. Firewalls do not help because the agents are executing authorized actions within permitted domains. Phishing campaigns often take weeks or months to coordinate with humans. An agent-driven breach can propagate at machine speed, chaining together permissions and actions faster than human response loops can keep up.
To defend this, organizations will need to put in things such as AI honeypot tokens to lure the bad agents, semantics that scan every agentic conversation, and much more sophisticated defense systems that most organizations won’t have in place in 2026. A credible path is identity-first controls and agent governance. Nonhuman identities require zero-trust security, full stop. They must be governed, continuously monitored and treated as untrusted by default. The risk is structural in that if one agent has access that was legitimately granted, and it can influence another agent, the effective access boundary expands beyond what the organization intended.
The market is already signaling urgency. Within the CISO community, agentic AI governance, protection and security is again a top topic. Qualitative trend data suggests that identity-centric and zero-trust principles are among the top priorities, and the mandate is moving from theory to budget and operations.
The vendor landscape is also shifting toward identity-centric consolidation and platform plays. The Palo Alto Networks Inc.-CyberArk Software Ltd. acquisition is a clear example of this direction. The practitioner requirement is for improved visibility, better decisioning based on data, and the ability to leverage identity intelligence as a defense mechanism. Security operations teams are already adopting agentic AI for triaging alerts and initial investigations, but the identity side is where the value becomes critical because identity is where the permissions live.
This relates with a broader dynamic we track every year – tool sprawl and consolidation intent versus consolidation reality. Practitioners consistently express interest in reducing tool counts, but the data shows limited actual consolidation so far. That creates exposure. Platform vendors argue they are seeing consolidation power their business. Practitioners largely agree consolidation is desirable and also acknowledge it is not happening fast enough to reduce risk materially.
Key takeaways
- We believe 2026 produces a documented agent-driven breach across SaaS platforms where no human credentials are stolen.
- The attack pattern is a logic hack where prompt injection or agent-to-agent manipulation spreads via trusted integrations such as MCP connections.
- Traditional defenses are poorly matched to the threat because actions are executed inside authorized channels and propagate at machine speed.
- Zero trust and identity-centric governance for nonhuman identities becomes foundational, with agent governance moving to the top of the chief information security officer priority list.
- Practitioner reality still shows limited security stack consolidation, increasing exposure even as vendors message platformization and consolidation.
The message here is that agentic systems expand the attack surface into a new domain where credentials are not stolen and malware is not planted, rather agent behavior is redirected. In our view, 2026 is the year this becomes visible in a major SaaS breach, and the organizations that are not operating identity-first, zero-trust governance for nonhuman identities are exposed to a class of risk that moves faster than their current defenses and operating models can respond.
Prediction No. 9: Hardware prices stay elevated into 2027
We believe hardware pricing remains elevated through 2026 and persists into 2027, driven by an ongoing memory shortage and a supply chain that is being reoriented around data center demand. High-bandwidth memory, NAND and RAM are in tight supply as data centers absorb capacity, and we expect that dynamic to keep pressure on pricing well beyond a normal cycle. In our view, this becomes a competitive differentiator for suppliers and OEMs that can secure allocation wins. Notably, buyers face a tougher refresh environment in 2026.
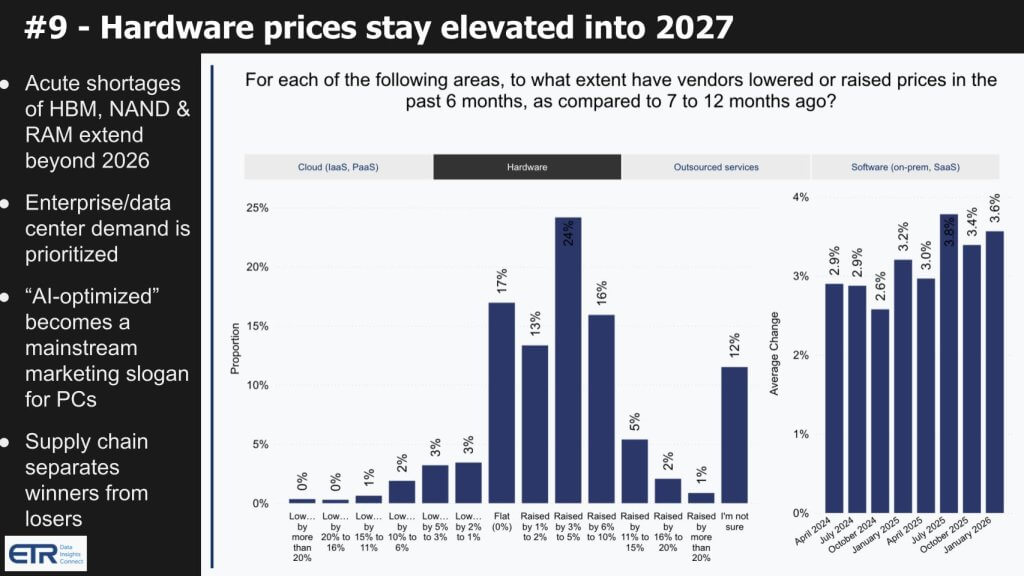
The chart above captures two things: 1) How respondents say hardware prices have moved recently; and 2) How that pricing trend has shifted over time.
Start with the distribution in the center. Respondents are asked: To what extent have vendors lowered or raised prices in the past six months compared to seven to twelve months ago? The responses are concentrated on the “raised” side. A meaningful portion of the sample reports increases in the mid-single digits and above, with a large block indicating raised by 3% to 5% as the most common outcome, followed by raised by 6% to 10% and additional cohorts seeing even larger jumps. At the high end, roughly 25% of respondents say prices rose 6% to 20% or more, which is a significant inflation indicator for hardware buyers.
Now anchor that with the time series on the right. The average change in hardware pricing bottomed in late 2024 at roughly 2% to 2.5%. Since then, the average has risen by about a full percentage point, reaching 3.6% in the latest survey. The implication is that hardware price inflation is not fading as a temporary post-pandemic trend. It is re-accelerating at a time when many organizations would normally be entering a refresh cycle.
We believe the supply-demand imbalance drives the continued trend, driven by AI factory demand. Vendors benefit from the current dynamic and have little incentive to rush pricing back down. Data center demand is being prioritized, and memory constraints ripple into everything from servers to storage to enterprise infrastructure to PCs. In our view, that is why terms like “AI-optimized” become mainstream marketing language, especially in PCs – memory becomes the gating factor, and vendors position optimization as product differentiation while supply remains constrained.
We also believe this has second-order effects across the enterprise stack. Hardware refresh cycles influence demand for adjacent categories that ride on those refreshes, including security appliances and networking infrastructure. As pricing pressure persists, refresh timing and configuration decisions will become more constrained, with related impacts for vendors across the infrastructure and security landscape.
Finally, we expect supply chain execution to be a competitive differentiator. Nvidia is likely to remain prioritized in the data center supply chain. On the PC side, it becomes a knife fight where scale and supply chain strength matter. Apple has scale. Dell is moving aggressively into consumer PCs and has a world-class supply chain. Storage vendors are already leaning into efficiency messaging, (for example, Vast Data Inc.’s flash efficiency messaging) and we expect more of that as the market stays constrained.
Key takeaways
- We believe hardware prices stay elevated into 2027 as memory shortages and data center demand keep supply tight.
- The data suggests hardware price inflation troughed in late 2024 at ~2% to 2.5% and has since risen to 3.6% in the latest ETR survey.
- Roughly a quarter of respondents report hardware price increases of 6% to 20% or more, signaling significant pricing pressure for buyers.
- Vendors benefit from the current supply-demand imbalance and have limited incentive to normalize pricing quickly.
- Persistent pricing pressure influences refresh cycles and creates second-order effects across compute, storage, networking and security hardware categories.
The message is that the hardware market is entering a prolonged period where memory-driven constraints keep prices higher for longer, supply chain access becomes a competitive weapon, and buyers face a more expensive refresh cycle that reverberates across infrastructure categories well into 2027.
Prediction No. 10: AI eats white-collar employment and shows up decisively in the numbers
We believe 2026 is the crossover year when AI’s impact on white-collar employment becomes visible in a way that is measurable and broadly acknowledged. The early impact is already seen in junior and entry-level roles, and this shows up in the data, first as headcount avoidance and then scaling without labor. In parallel, we expect sustained growth in blue-collar roles tied to the data center buildout – specialized trades and technical operators such as “artisan” plumbers, HVAC engineers, builders, and cooling experts – where demand is already high and rising.
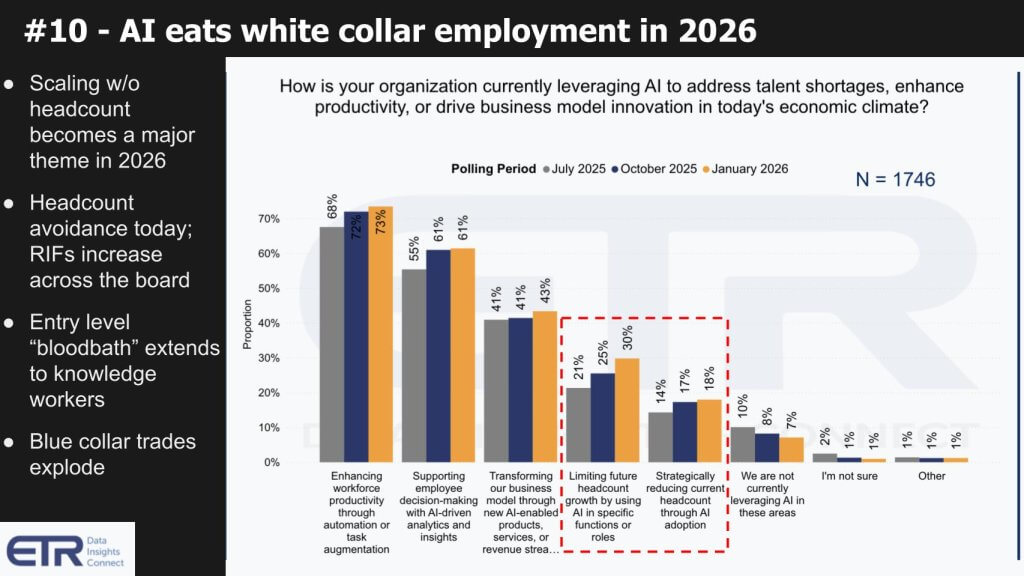
The ETR survey data is already moving in the direction of this prediction. In July 2025, 21% of respondents said they were limiting future headcount due to AI. That figure has increased to 30% in the latest read. This trend is more pronounced in larger firms, which we see as the leading indicator. Among Global 2000 organizations, the number rises to 34%. Among Fortune 100 companies, 42% say they plan to limit future headcount because of AI. The message is that the larger the organization, the more aggressive the posture on future headcount constraints tied directly to AI.
We are also seeing movement from avoidance to reduction. Strategic headcount reduction attributed to AI is rising more slowly than avoidance, but the increase from 14% to 18% in roughly half a year is material. These are not marginal shifts, and they are not based on a small or anecdotal sample. The survey represents roughly 1,800 qualified IT experts and IT decision makers across industries, which makes the directional signal difficult to dismiss.
We believe this sits inside a larger pattern that plays out in major technology transitions. Over successive waves – mainframes to PCs, then the internet, cloud, mobile, social, and big data – markets tend to reward the new before the new is large enough to offset the decline in the old. That mismatch creates volatility and shifting narratives. We see it today in sector rotation and sentiment – semiconductors in favor, SaaS out of favor – and we expect those narratives to continue shifting. The sensible approach is to focus on the data, filter out headline noise, and track the adoption signals that show up in spending behavior and operating model changes.
In our opinion, AI is larger than prior waves because it stands on the shoulders of them all. It changes the unit economics of work, and that shows up first in constrained hiring and then in reductions as organizations learn where automation is durable. Over time, we expect labor demand to rebalance, with new job creation tied to physical infrastructure and AI-enabled industries, but 2026 is positioned to be the year where the labor displacement data becomes hard to ignore.
Key takeaways
- The data suggests AI-driven headcount avoidance is accelerating: 21% in July 2025 rising to 30% in the latest read.
- The upmarket signal is strongest: 34% for Global 2000 and 42% for Fortune 100 planning to limit future headcount from AI.
- AI-driven strategic headcount reduction is also rising, moving from 14% to 18% in roughly half a year.
- The survey sample is large (about 1,800 qualified IT decision-makers), supporting the view that this is a real trend rather than anecdote.
- We expect blue-collar roles tied to data center buildouts to grow meaningfully as the physical infrastructure layer expands.
The message is that 2026 becomes the year AI’s labor impact is visible in enterprise headcount decisions at scale, led by hiring constraints in the largest organizations and followed by rising reductions, while demand for specialized blue-collar roles expands alongside the data center buildout and the broader AI infrastructure wave.
We’re beyond the first inning of this AI era, which started really in 2017 with research papers on diffusion models and transformers. The ChatGPT moment exposed AI’s potential to the masses and now we’re entering the enterprise adoption phase, which we see as the real opportunity.
How you see 2026 shaping up? Please let us know as we always appreciate the feedback.
Disclaimer: All statements made regarding companies or securities are strictly beliefs, points of view and opinions held by News Media, Enterprise Technology Research, other guests on theCUBE and guest writers. Such statements are not recommendations by these individuals to buy, sell or hold any security. The content presented does not constitute investment advice and should not be used as the basis for any investment decision. You and only you are responsible for your investment decisions.
Disclosure: Many of the companies cited in Breaking Analysis are sponsors of theCUBE and/or clients of Wikibon. None of these firms or other companies have any editorial control over or advanced viewing of what’s published in Breaking Analysis.
Image: theCUBE Research/ChatGPT
Support our mission to keep content open and free by engaging with theCUBE community. Join theCUBE’s Alumni Trust Network, where technology leaders connect, share intelligence and create opportunities.
- 15M+ viewers of theCUBE videos, powering conversations across AI, cloud, cybersecurity and more
- 11.4k+ theCUBE alumni — Connect with more than 11,400 tech and business leaders shaping the future through a unique trusted-based network.
About News Media
Founded by tech visionaries John Furrier and Dave Vellante, News Media has built a dynamic ecosystem of industry-leading digital media brands that reach 15+ million elite tech professionals. Our new proprietary theCUBE AI Video Cloud is breaking ground in audience interaction, leveraging theCUBEai.com neural network to help technology companies make data-driven decisions and stay at the forefront of industry conversations.


