
Advertising on social media remains a top strategy for businesses looking to thrive despite growing competition. In fact, our recent small business marketing trends report found that half of small businesses are planning to invest in social ads this year.
Those businesses are seeking advertising opportunities on key social platforms like Meta Ads, which allows them to target users on Facebook, Instagram, WhatsApp, and other Meta-owned apps.
So, you know you want to dedicate resources towards Facebook ads to stay competitive and effectively engage your target market. But how much will that cost you? And what can you expect in terms of results?
We’ve got the answers to all these questions and more in this year’s annual Facebook ads benchmarks report, analyzing data from over 1,000 campaigns to provide you with industry-specific KPIs including average cost per click (CPC), click-through rate (CTR), conversion rate (CVR), and cost per lead (CPL) for two core Facebook ads campaign objectives: traffic and leads.
Contents
🏃 Want to take this data to go? Download our free 2025 Facebook ads benchmarks report here!
Key trends: The big picture
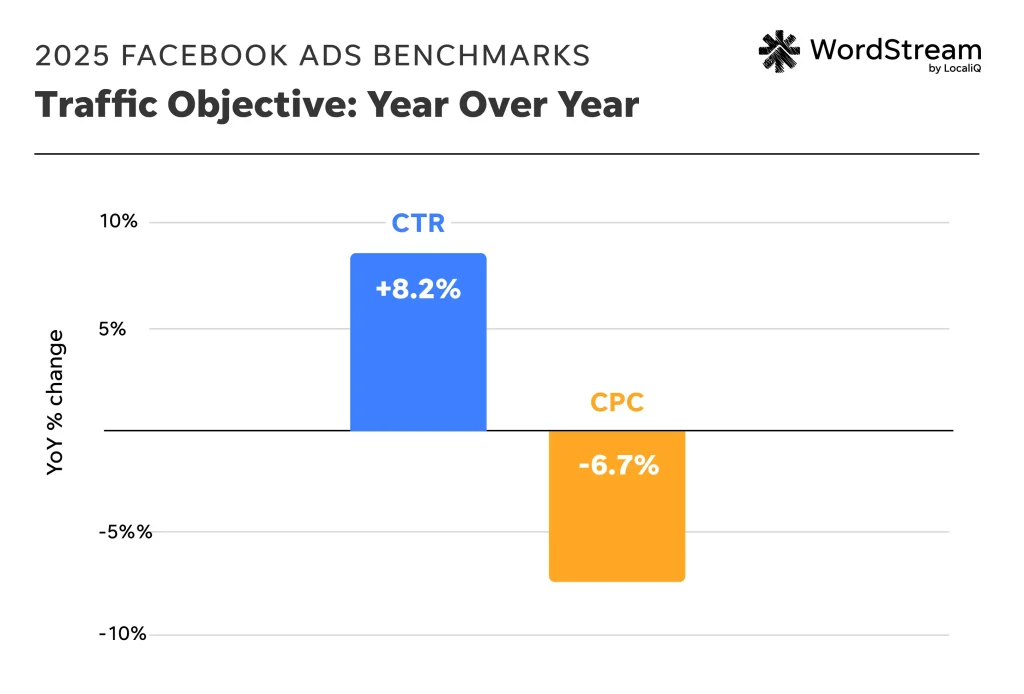
Facebook ads with a traffic objective saw strong improvement year over year, with both higher CTR and lower CPC compared to 2024.
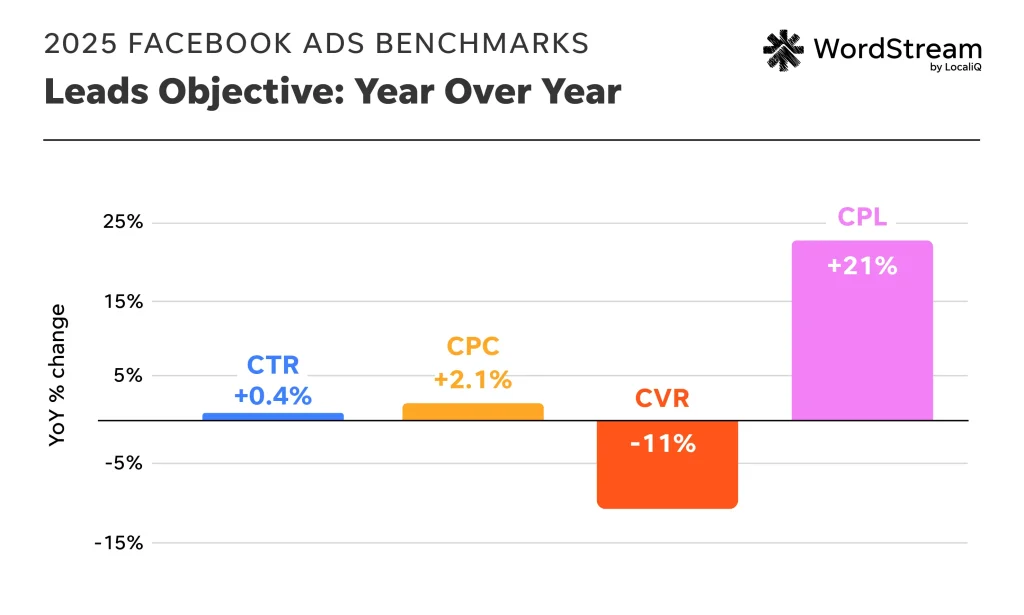
Facebook leads campaigns saw performance declines, with a 20% increase in CPL. However, CPC and CPL for this ad type are still significantly lower than comparable ads on Google. Despite rising advertising costs and economic challenges, Facebook Lead Ads maintain a cost advantage over Google Ads. This means that social ads are the perfect complement to your search strategy.
- Facebook Lead Ads click-through rates increased for 9 out of 15 industries, with an overall slight increase year over year. This shows that Facebook users are still engaging with ads on the Meta platform.
- The cost per click for Facebook leads objective campaigns increased overall, but 10 out of 15 industries (67%) saw stable or decreased CPCs. Advertising costs are increasing across the board—87% of industries saw increases in CPC for Google Ads, with an overall increase of 12.88%. Lead Ads saw a slower rate of increase—only 2.13% compared to 2024. And CPC is still relatively low for Lead Ads at $1.92, compared to $5.26 in Google Ads.
- For Facebook leads campaigns, 12 out of 15 industries (80%) saw a decrease in conversion rate year over year. This follows an overall increase we saw last year. Many of the industries impacted could be seeing decreases due to the economy. For example, fewer people may be looking for entertainment, taking on home improvement projects, or investing in beauty and personal care—leading to a decrease in CVR for these industries.
- Facebook leads campaigns cost per lead increased for 9 out of 15 (60%) industries, and CPL increased 20.94% overall to $27.66. This, again, could be due to the overall increase in advertising costs we’re seeing across the board due to increased competition, privacy restrictions that impact ad targeting, and inflation. However, Lead Ads CPL is substantially lower than the average CPL of Google Ads at $70.11.
- For Facebook traffic campaigns, click-through rates increased YOY for 11 out of 22 industries (71%) after a year of increases last year as well, with an overall increase of 8.23%. This could speak to better messaging and/or targeting alignment in this category.
- Facebook traffic campaign CPCs decreased for 10 out of 21 industries (48%), with an overall cost per click of only $0.70, which is a 6.67% decrease in CPC YoY as well as much lower than the average CPC of $5.26 in Google Ads. This speaks to the effectiveness of this Facebook ads objective in driving clicks to your website.
So, if you’re wondering if Facebook traffic or leads campaigns are right for your business in 2025, this data proves they can be a stable and reliable strategy in light of market fluctuations.
“We are finally starting to see inflation’s impact on campaign metrics. Although CPC, CVR, and CPL have all taken a hit this year, CTR improving in spite of higher costs means that consumers are continuing to engage with advertising, which is a good sign for businesses having to front more marketing dollars behind their campaigns,” said Tyler Mask, Director of Optimization Strategy at LocaliQ.
⚡ Wondering how you can improve your Facebook ads campaigns to get ahead of your competitors? Start with a free, instant account audit using our Facebook Ads Grader!
Facebook ads benchmarks: Traffic campaigns
Traffic campaigns are a universally popular Facebook ads objective used by small businesses because they effectively prioritize driving clicks. This Facebook objective guides your campaigns to serve your ads to audiences most likely to click.
Traffic to your website, landing page, app, or event, is half the battle when securing conversions—so traffic objective campaigns are a go-to for most advertisers on Facebook.
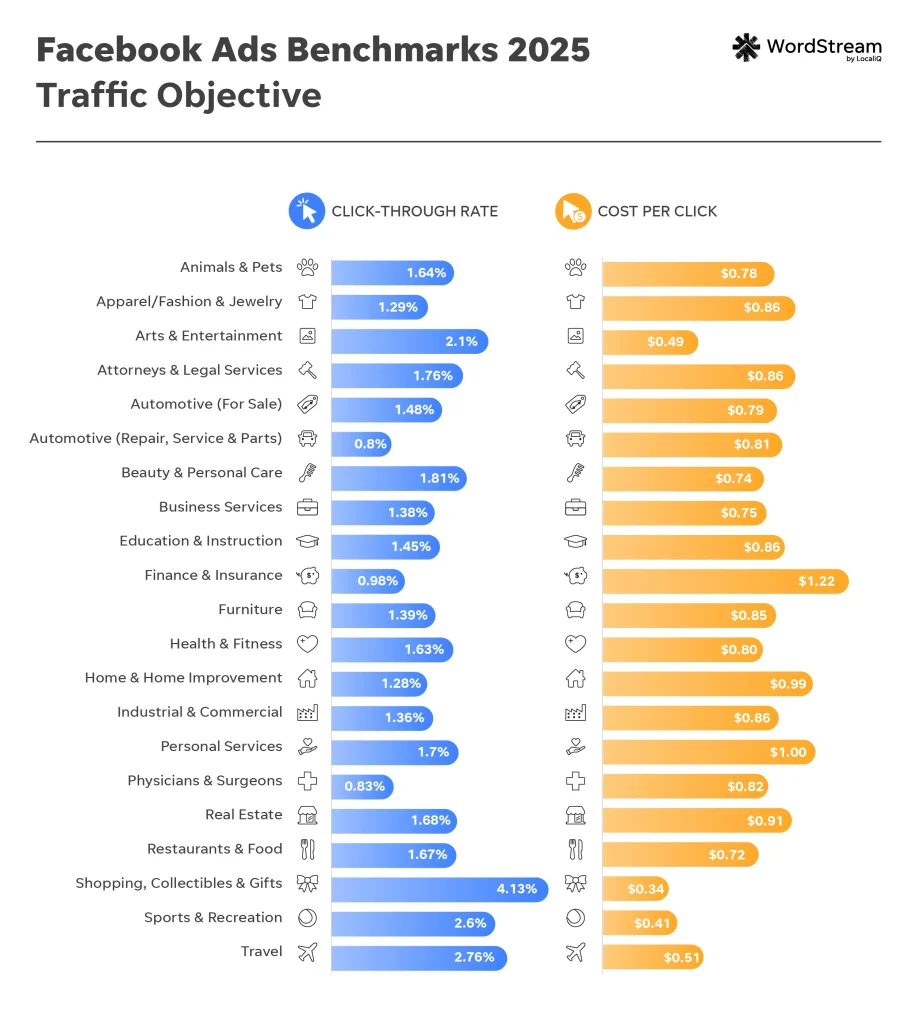
Click to enlarge
Note: Since this campaign objective is specifically designed to drive traffic, cost per lead and conversion rate metrics tend to be on the higher side. It’s important to focus on the metrics that matter most for your ad objective, so we’ve omitted those metrics here.
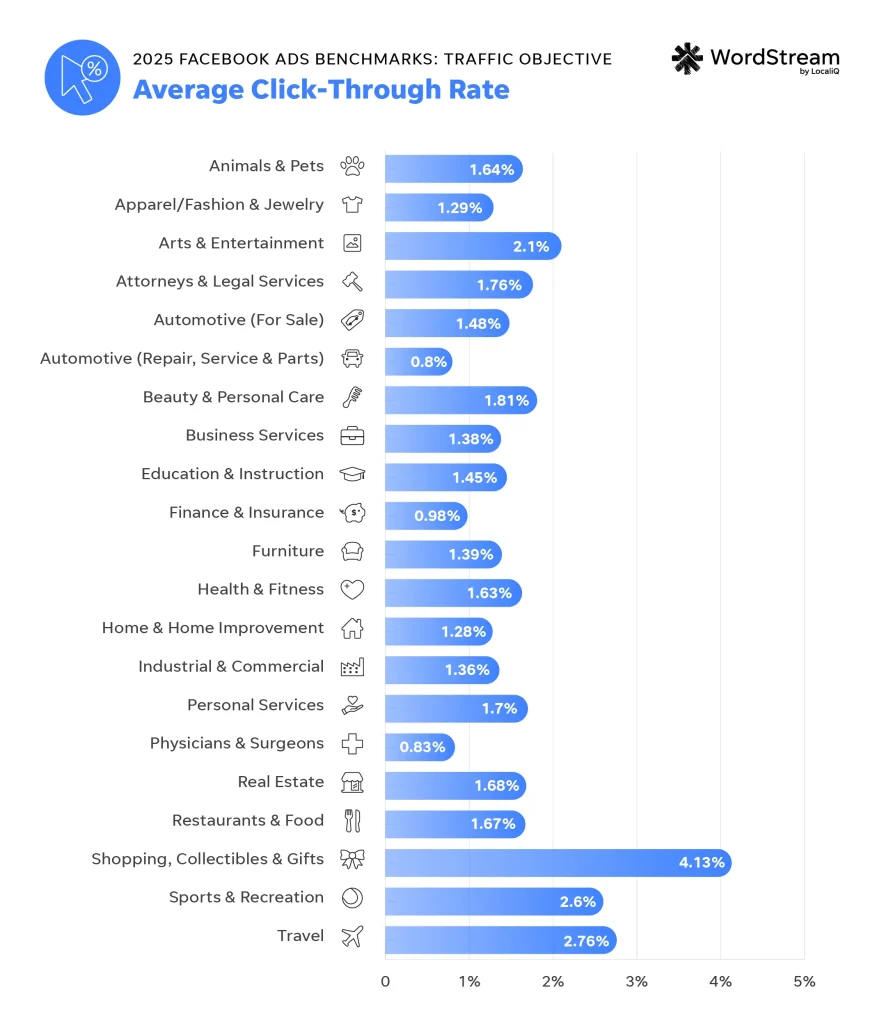
Average click-through rate for traffic campaigns
Click-through rate is a core metric when it comes to traffic campaigns because, after all, they’re optimized for clicks.
The average click-through rate in Facebook ads for traffic campaigns across all industries is 1.71%. This is higher than last year’s overall average of 1.57%.
| Business Category | Average CTR |
| Animals & Pets | 1.64% |
| Apparel / Fashion & Jewelry | 1.29% |
| Arts & Entertainment | 2.10% |
| Attorneys & Legal Services | 1.76% |
| Automotive — For Sale | 1.48% |
| Automotive — Repair, Service & Parts | 0.80% |
| Beauty & Personal Care | 1.81% |
| Business Services | 1.38% |
| Education & Instruction | 1.45% |
| Finance & Insurance | 0.98% |
| Furniture | 1.39% |
| Health & Fitness | 1.63% |
| Home & Home Improvement | 1.28% |
| Industrial & Commercial | 1.36% |
| Personal Services | 1.70% |
| Physicians & Surgeons | 0.83% |
| Real Estate | 1.68% |
| Restaurants & Food | 1.67% |
| Shopping, Collectibles & Gifts | 4.13% |
| Sports & Recreation | 2.60% |
| Travel | 2.76% |
The industries with the highest click-through rates were Shopping, Collectibles, and Gifts (4.13%), Travel (2.76%), and Sports and Recreation (2.60%).
Meanwhile, the industries with the lowest click-through rates were Automotive—Repair, Services, and Parts (0.80%), Physicians and Surgeons (0.83%), and Finance and Insurance (0.98%).
The industries with the highest CTRs, such as Shopping, Collectibles, and Gifts, or Sports and Recreation, are typically those that offer “anytime treats.” In other words, you don’t need to be in the market to respond to these types of ads as people can be tempted into shopping or recreation anytime. On the other hand, industries such as Automotive—Repair, Services, and Parts and Finance and Insurance, can’t always rely on compelling visuals to increase their Facebook ad CTRs. It’s harder to get clicks on ads for industries where only some of the audience is going to be in market. These business types need to focus on engaging ads and pairing the right copy and creative with the right audience targeting strategy to maintain competitive CTRs.
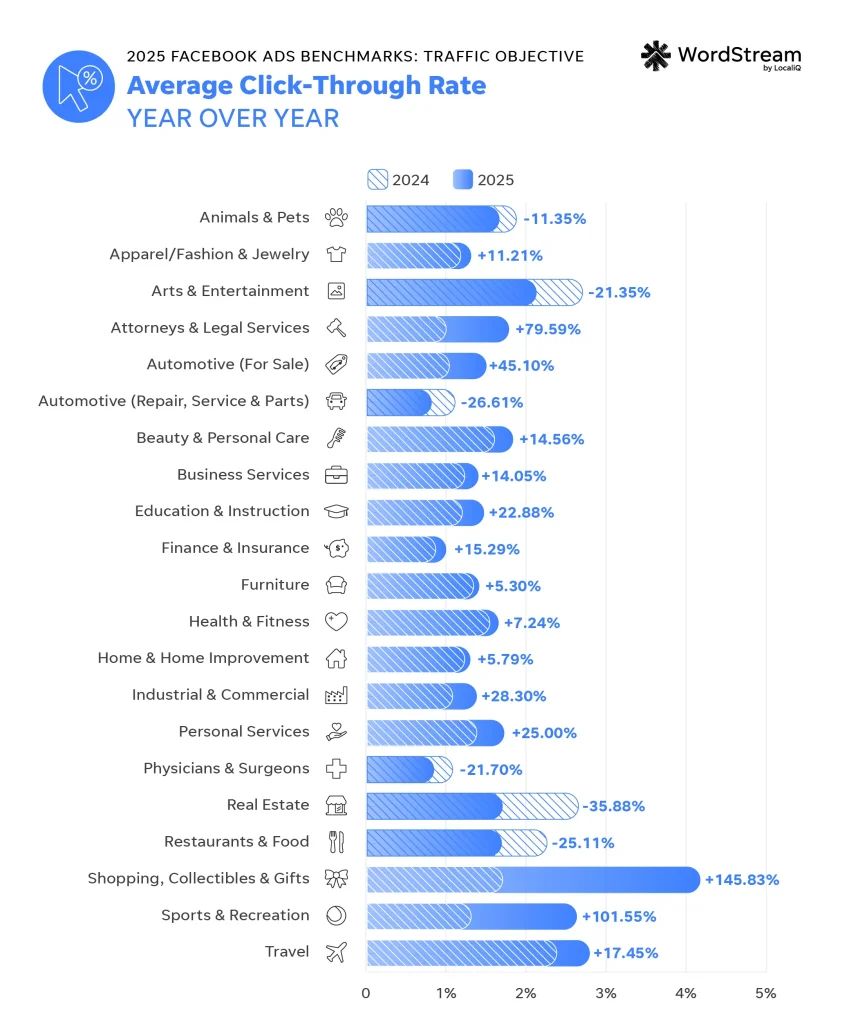
Average click-through rate: YoY
While the overall CTR for Facebook ads traffic campaigns increased slightly year over year, the industries that saw the biggest decreases in average CTR compared to 2024 were Real Estate (down 36%), Automotive—Repair, Services, and Parts (down 27%), and Restaurants and Food (down 25%).
On the opposite end, the industries that saw the biggest year-over-year increases in average CTR were Shopping, Collectibles, and Gifts (up 146%), Sports and Recreation (up 102%), and Attorneys and Legal Services (up 80%).
Average cost per click for traffic campaigns
Cost per click is a critical PPC metric for Facebook ad traffic campaigns. If you’re not maintaining a low CPC consistently, an increase in clicks due to the campaign’s behavior can accelerate your spend.
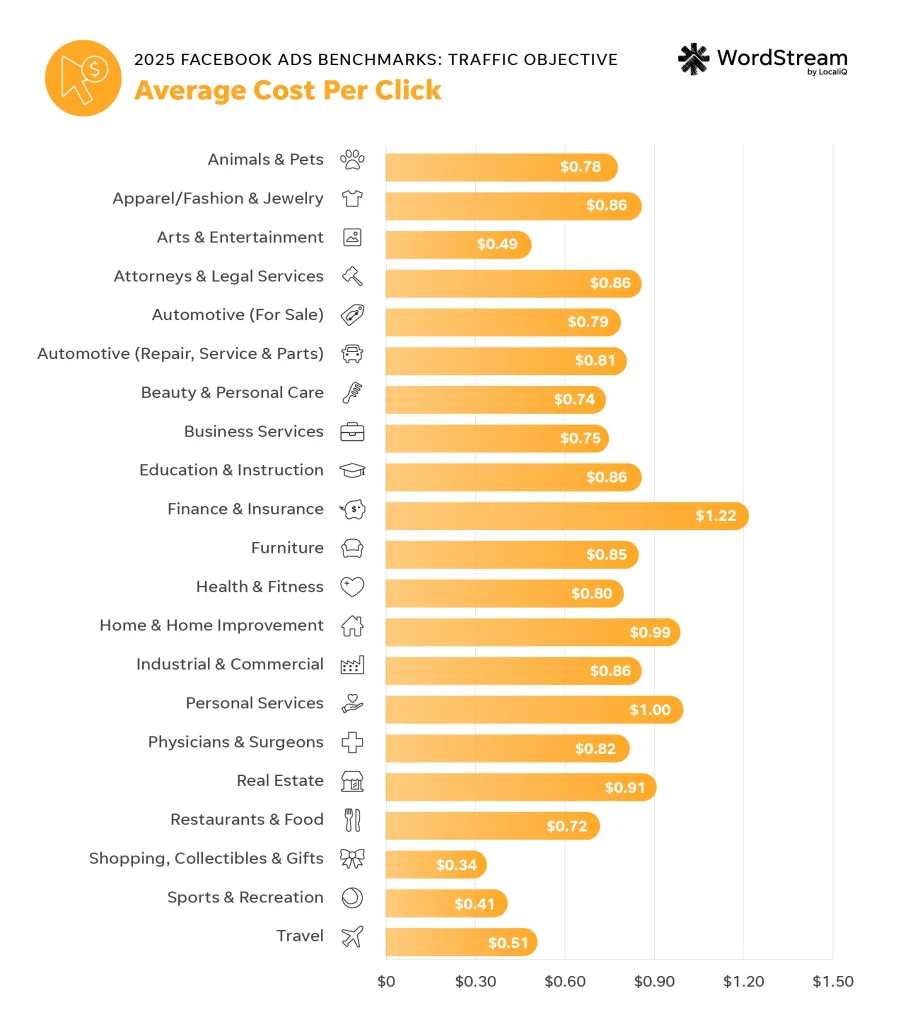
The average cost per click in Facebook ads for traffic campaigns across all industries is $0.70. This is lower than last year’s overall CPC average of $0.77.
| Business Category | Average CPC |
| Animals & Pets | $0.78 |
| Apparel / Fashion & Jewelry | $0.86 |
| Arts & Entertainment | $0.49 |
| Attorneys & Legal Services | $0.86 |
| Automotive — For Sale | $0.79 |
| Automotive — Repair, Service & Parts | $0.81 |
| Beauty & Personal Care | $0.74 |
| Business Services | $0.75 |
| Education & Instruction | $0.86 |
| Finance & Insurance | $1.22 |
| Furniture | $0.85 |
| Health & Fitness | $0.80 |
| Home & Home Improvement | $0.99 |
| Industrial & Commercial | $0.86 |
| Personal Services | $1.00 |
| Physicians & Surgeons | $0.82 |
| Real Estate | $0.91 |
| Restaurants & Food | $0.72 |
| Shopping, Collectibles & Gifts | $0.34 |
| Sports & Recreation | $0.41 |
| Travel | $0.51 |
Industries with the highest CPCs included Finance and Insurance ($1.22), Personal Services ($1.00), and Home and Home Improvement ($0.99).
In contrast, the lowest CPC industries included Shopping, Collectibles, and Gifts ($0.34), Sports and Recreation ($0.41), and Arts and Entertainment ($0.49).
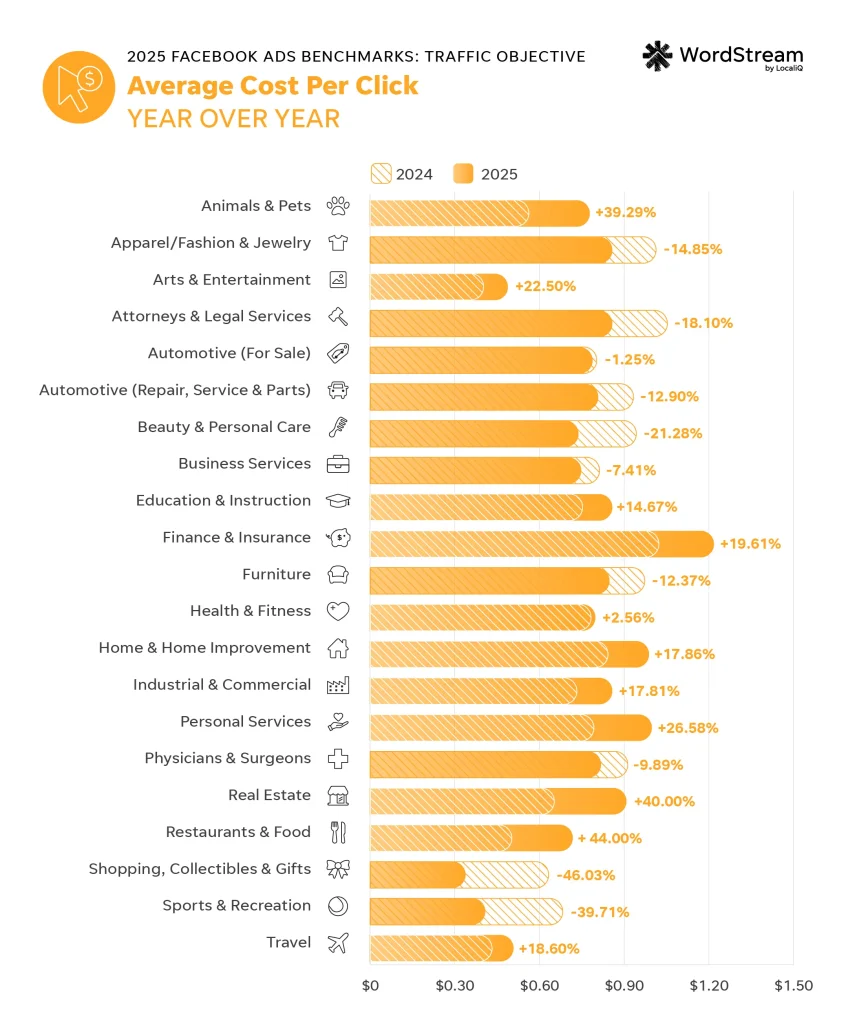
Average cost per click: YoY
The industries that saw the biggest decreases in average CPC compared to 2024 were Shopping, Collectibles, and Gifts (down 46%), Sports and Recreation (down 40%), and Beauty and Personal Care (down 21%).
The industries that had the largest increases in CPC included Restaurants and Food (up 44%), Real Estate (up 40%), and Animals and Pets (up 39%).
Facebook ads benchmarks: Leads campaigns
Facebook ads campaigns using the leads objective actively optimize how your ads are served for the most leads possible.
To run Facebook leads campaigns on Meta, you’ll have to create Facebook Lead Ads, which allow users to become leads with your business directly from the platform.
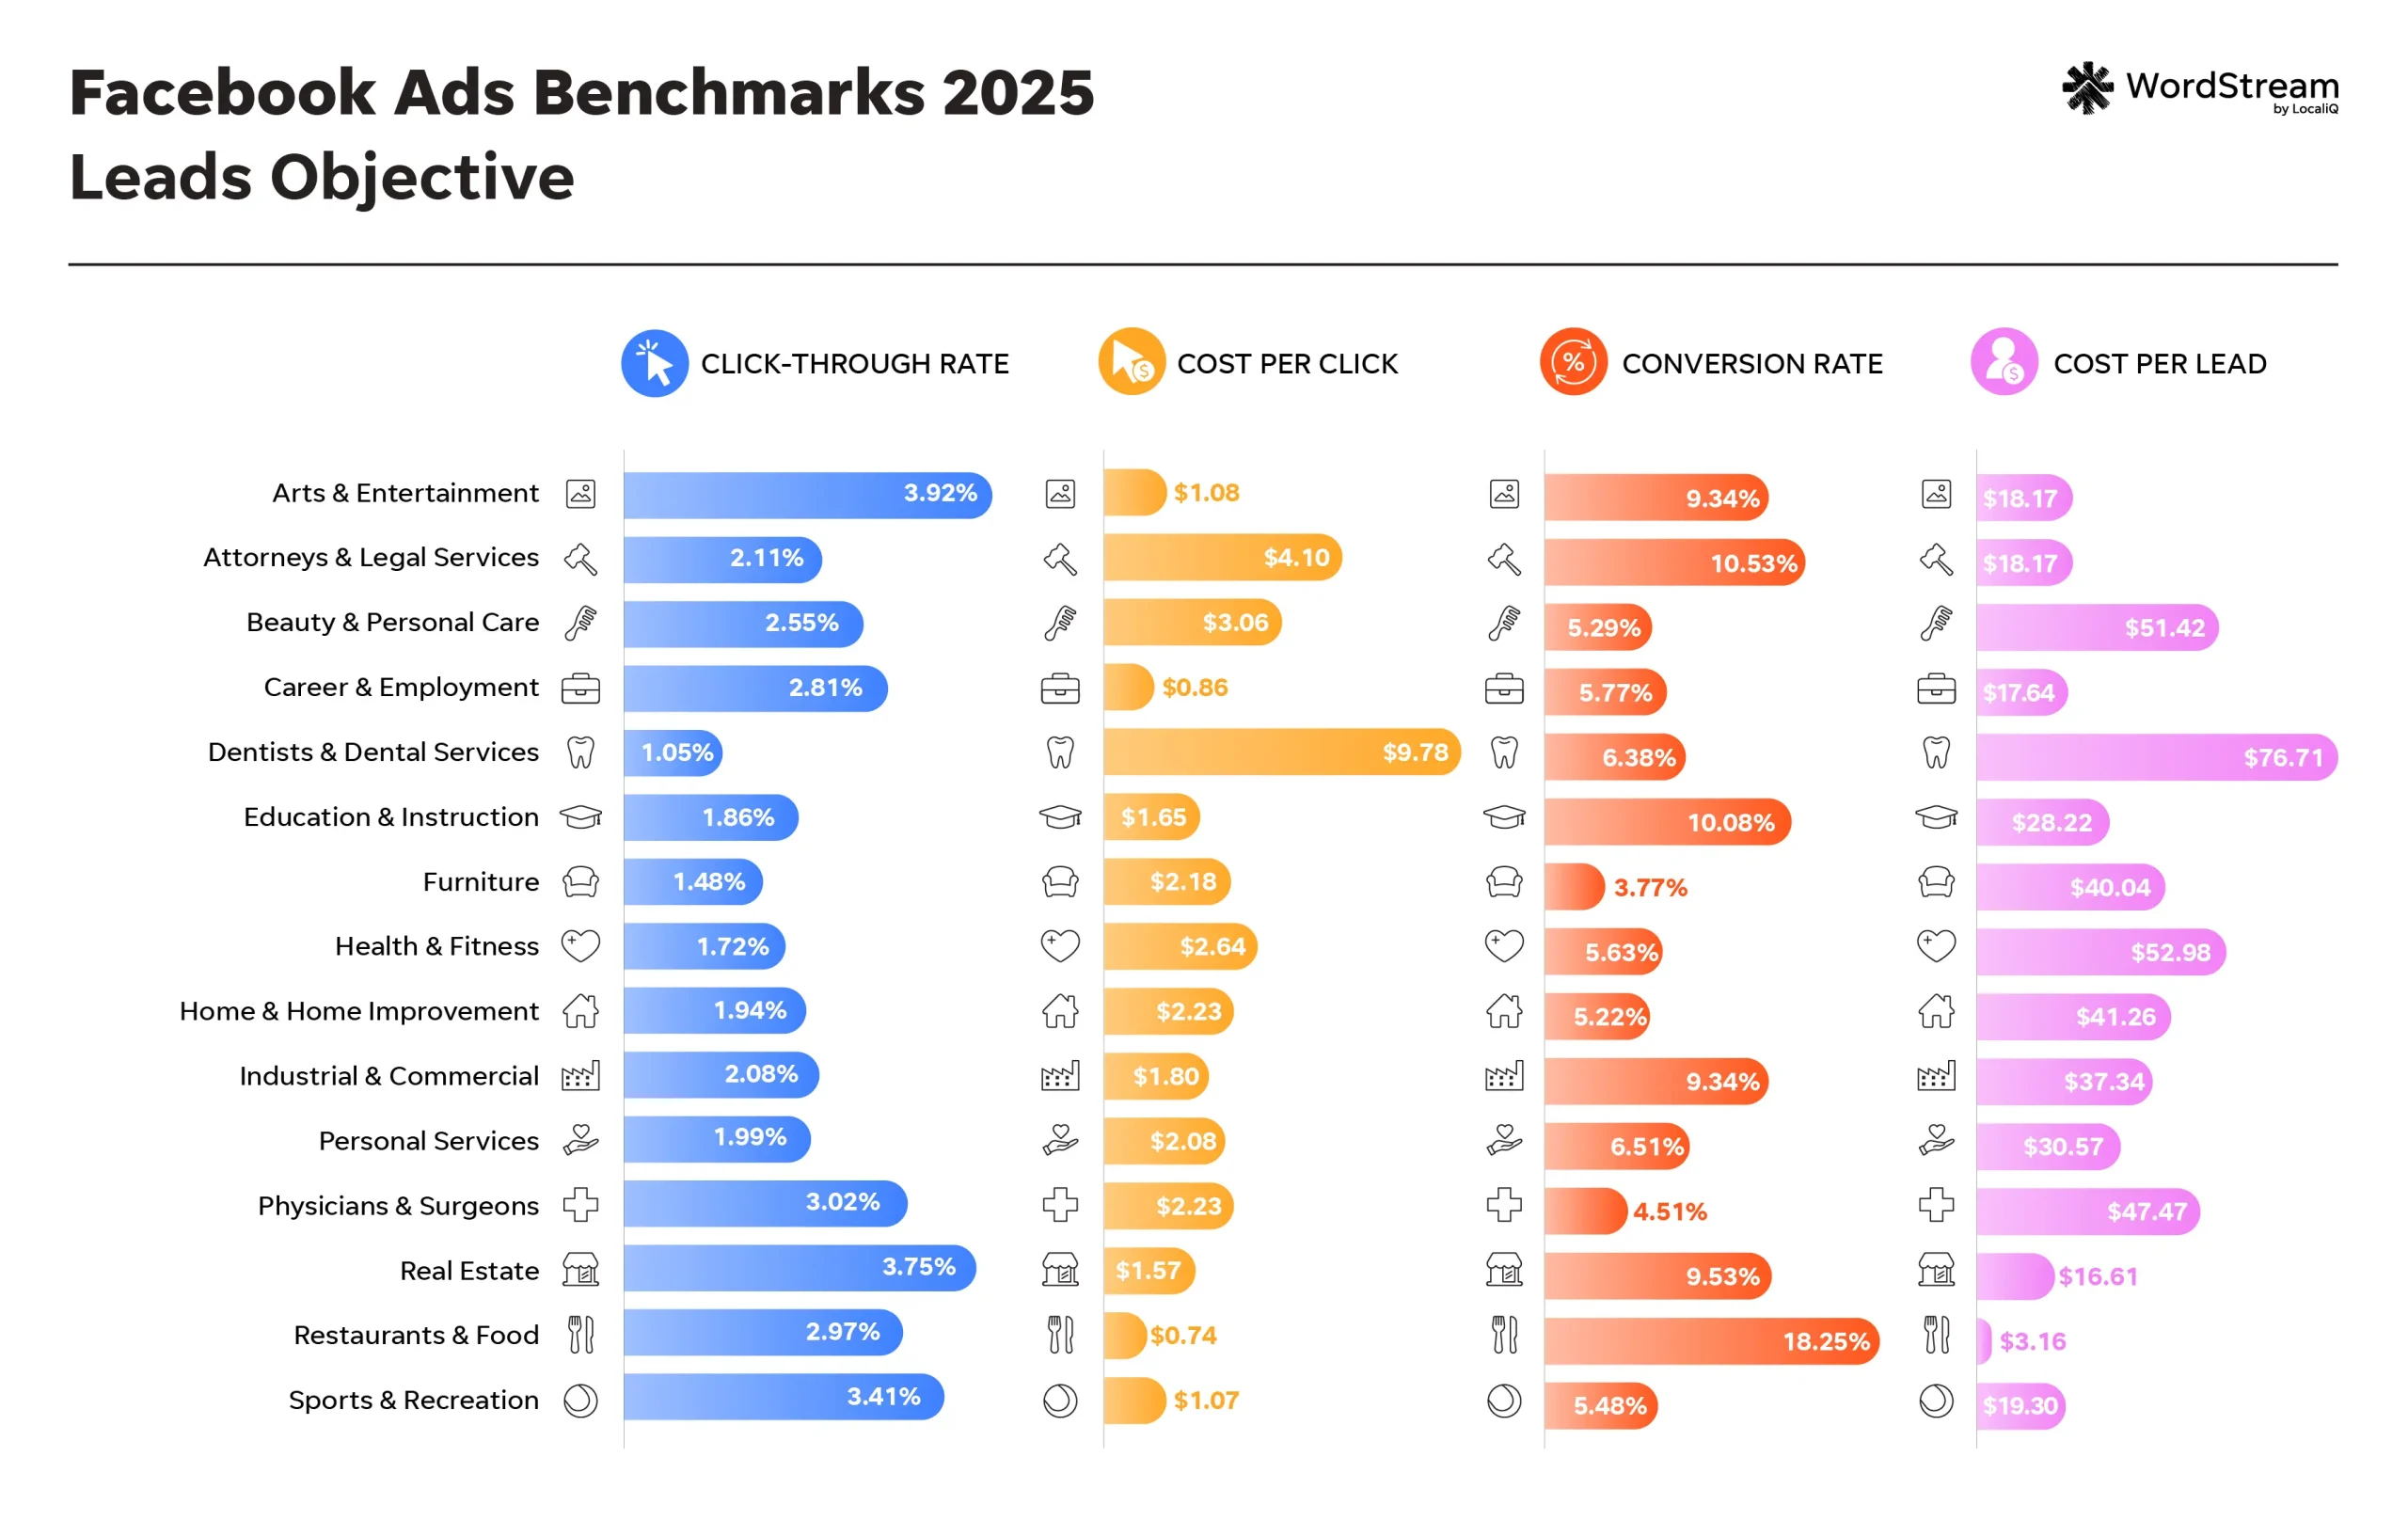
Click to enlarge
We’ve included conversion rate and cost per lead as part of these benchmarks since this objective is optimized to drive leads and conversions.
Average click-through rate for leads campaigns
A high click-through rate on Facebook leads campaigns tends to equate to high-quality ad copy and creative elements. When your Facebook Lead Ads are effective at driving clicks, it means your ads are compelling enough to draw people in and become leads with your business. So, naturally, click-through tends to be prioritized by businesses looking to generate more leads through Meta Ads.
The average click-through rate in Facebook ads for leads campaigns across all industries is 2.59%. This is about the same as last year’s average of 2.58%.
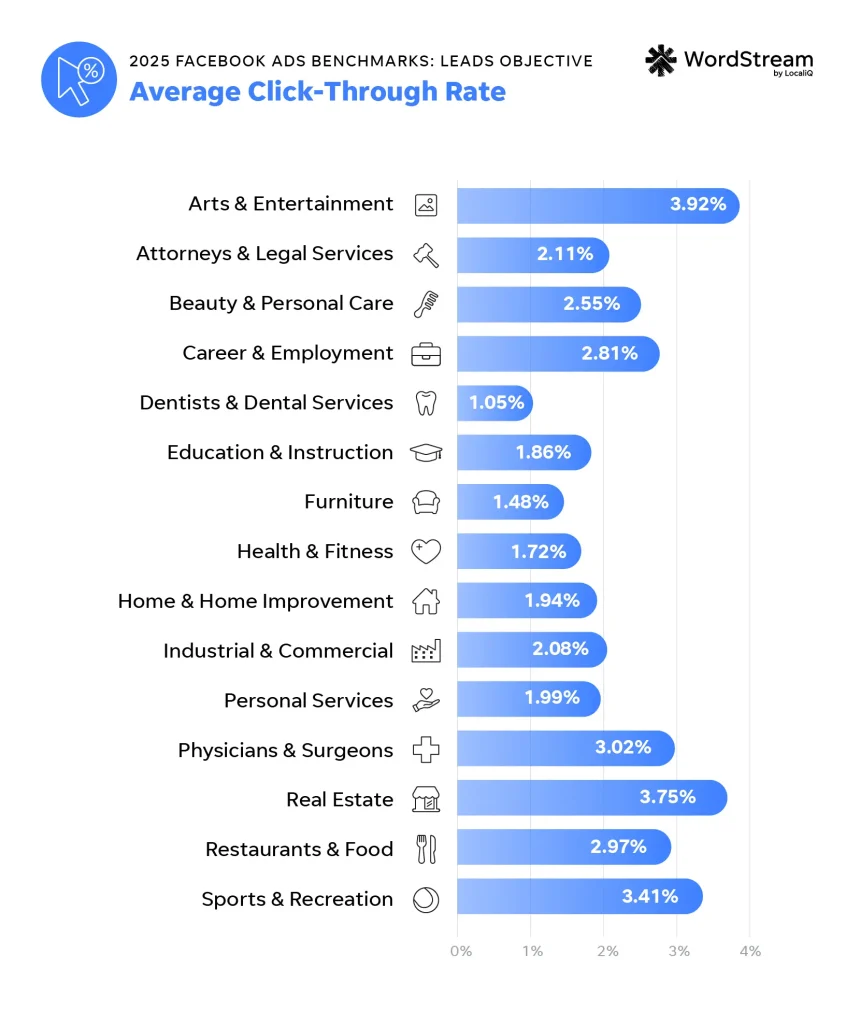
| Business Category | Average CTR |
| Arts & Entertainment | 3.92% |
| Attorneys & Legal Services | 2.11% |
| Beauty & Personal Care | 2.55% |
| Career & Employment | 2.81% |
| Dentists & Dental Services | 1.05% |
| Education & Instruction | 1.86% |
| Furniture | 1.48% |
| Health & Fitness | 1.72% |
| Home & Home Improvement | 1.94% |
| Industrial & Commercial | 2.08% |
| Personal Services | 1.99% |
| Physicians & Surgeons | 3.02% |
| Real Estate | 3.75% |
| Restaurants & Food | 2.97% |
| Sports & Recreation | 3.41% |
The highest click-through rate industries for Facebook leads campaigns were Arts and Entertainment at 3.92%, Real Estate at 3.75%, and Physicians and Surgeons at 3.02%. These types of businesses typically use engaging images, which makes their ads an ideal fit for those surfing social media.
Meanwhile, the lowest click-through rate industries for Facebook leads campaigns were Dentists and Dental Services at 1.05%, Furniture at 1.48%, and Health and Fitness at 1.72%. People aren’t always actively in the market for these more specific services, so it’s important for businesses in these types of industries to balance out their strategies with search ads for higher click-through rates across the board.
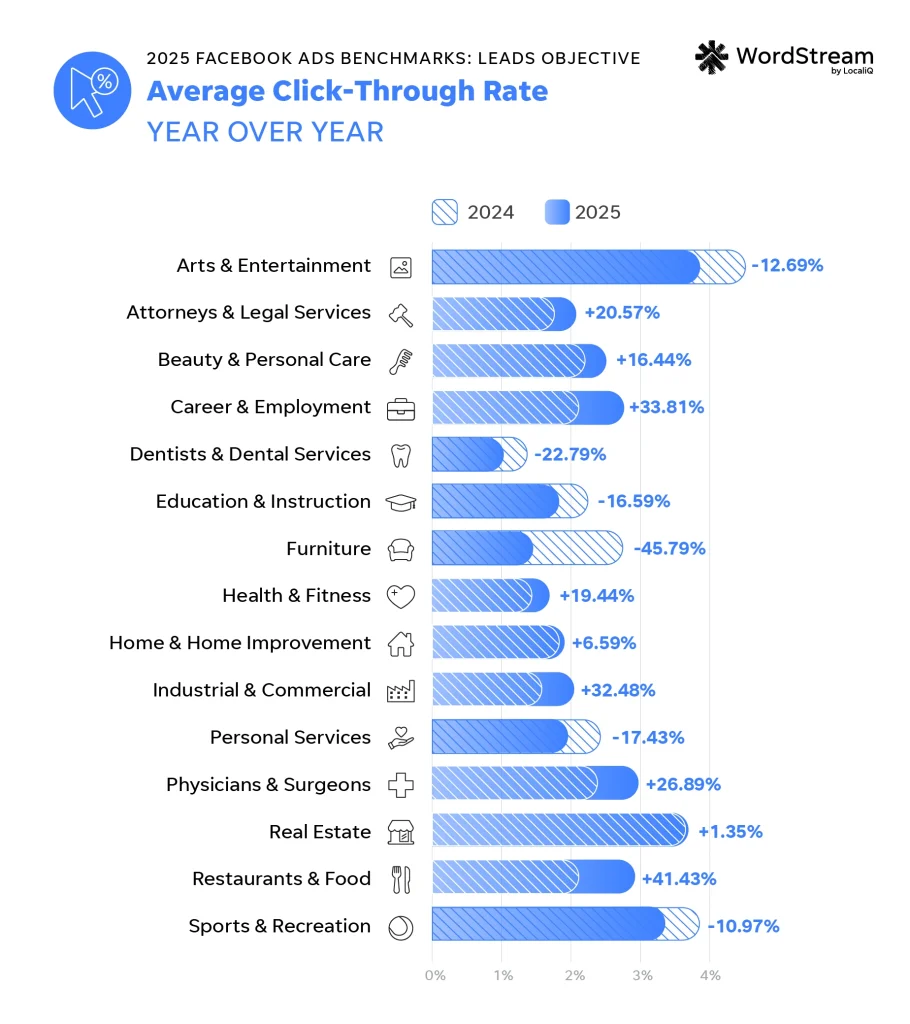
Average click-through rate: YoY
The following industries saw the biggest year-over-year increases in CTR: Restaurants and Food (+41%), Career and Employment (+34%), and Industrial and Commercial (+32%).
In contrast, the following industries saw the biggest year-over-year decreases in CTR: Furniture (-46%), Dentists and Dental Services (-23%), and Personal Services (-17%).
Average cost per click for leads campaigns
Since you get charged for a click on a Facebook lead ad even if that click doesn’t fully turn into a lead, you still want to maintain as low of a CPC as possible for this campaign objective.
The average cost per click in Facebook ads for leads campaigns across all industries is $1.92. This is lower than last year’s, which was $1.88.
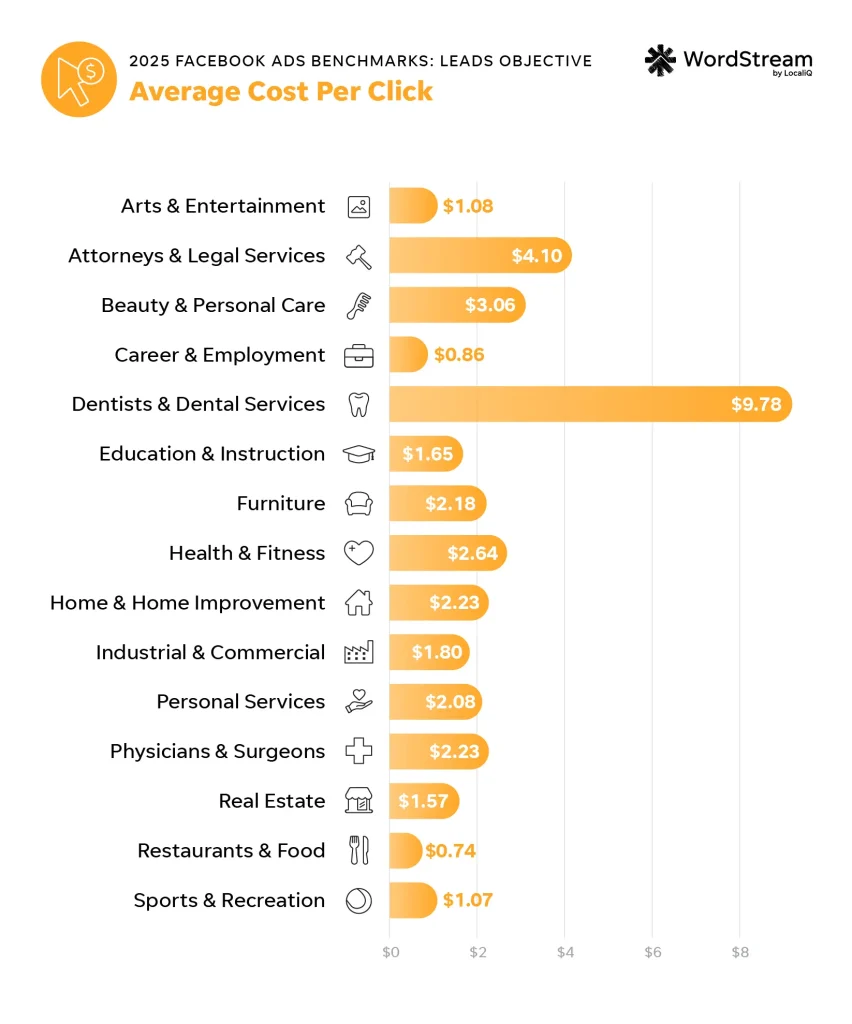
| Business Category | Average CPC |
| Arts & Entertainment | $1.08 |
| Attorneys & Legal Services | $4.10 |
| Beauty & Personal Care | $3.06 |
| Career & Employment | $0.86 |
| Dentists & Dental Services | $9.78 |
| Education & Instruction | $1.65 |
| Furniture | $2.18 |
| Health & Fitness | $2.64 |
| Home & Home Improvement | $2.23 |
| Industrial & Commercial | $1.80 |
| Personal Services | $2.08 |
| Physicians & Surgeons | $2.23 |
| Real Estate | $1.57 |
| Restaurants & Food | $0.74 |
| Sports & Recreation | $1.07 |
The industries with the highest CPCs were Dentists and Dental Services ($9.78), Attorneys and Legal Services ($4.10), and Beauty and Personal Care ($3.06).
The industries with the lowest CPCs were Restaurants and Food ($0.74), Career and Employment ($0.86), and Sports and Recreation ($1.07).
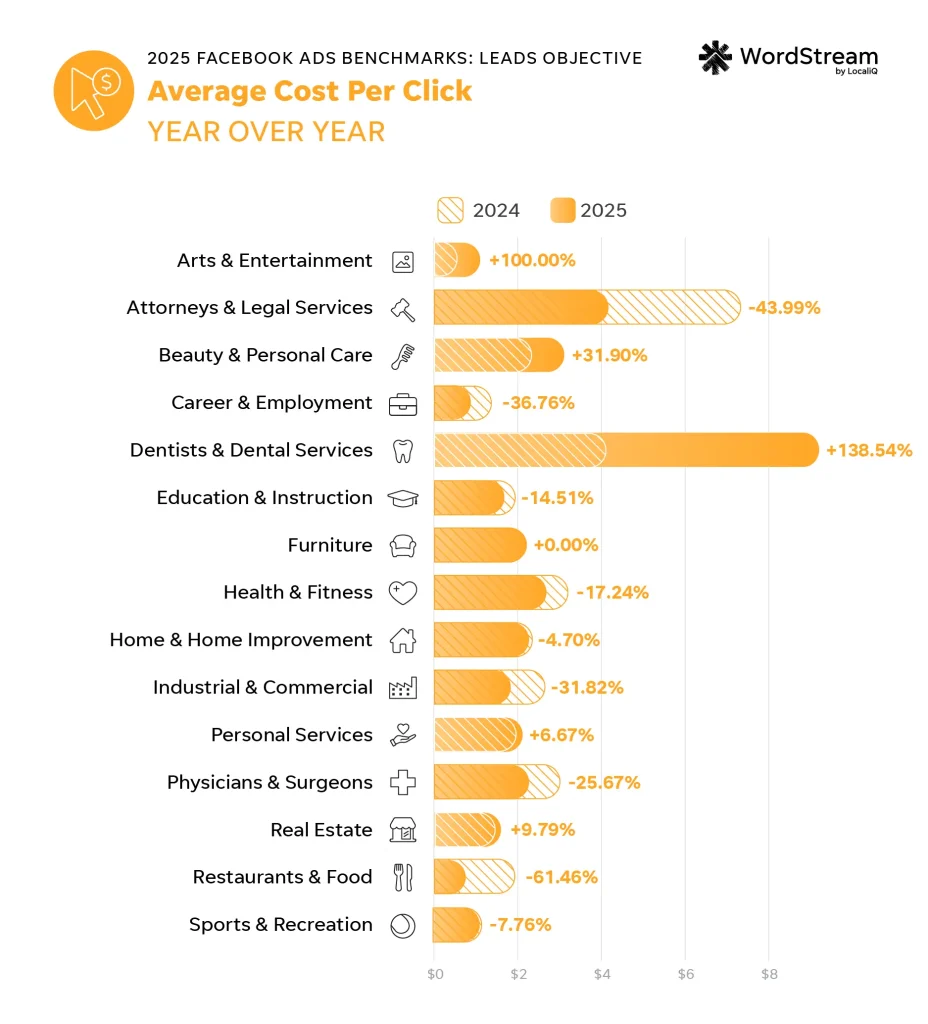
Average cost per click: YoY
The industries that saw the biggest drops in CPC were Restaurants and Food (down 61%), Attorneys and Legal Services (down 44%), and Career and Employment (down 37%).
The industries that saw the biggest increases in CPC were Dentists and Dental Services (up 139%), Arts and Entertainment (up 100%), and Beauty and Personal Care (up 32%).
Average conversion rate for leads campaigns
In a Facebook leads campaign, conversion rate shows how effective your ads are at turning interest into action, regardless of whether that’s a sign-up, a form fill, or any other lead conversion event in between.
The average conversion rate in Facebook ads for leads campaigns across all industries is 7.72%—lower than last year’s overall average of 8.67%.
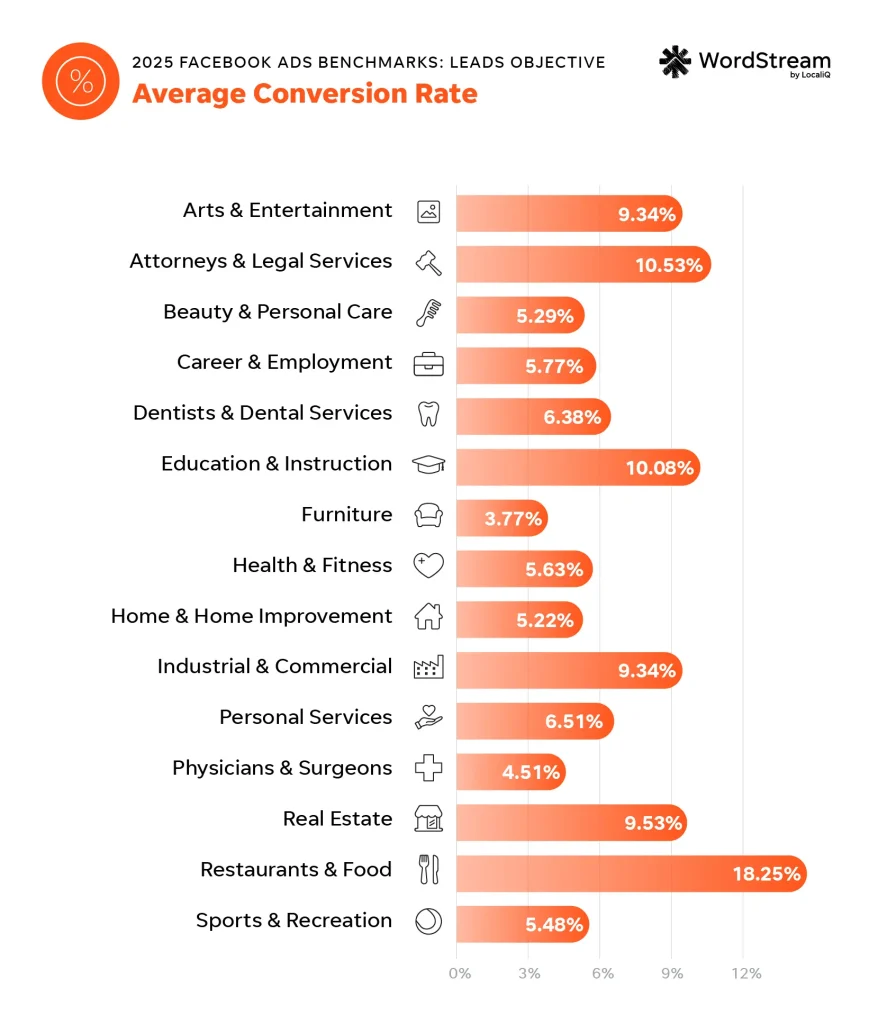
| Business Category | Average CVR |
| Arts & Entertainment | 9.34% |
| Attorneys & Legal Services | 10.53% |
| Beauty & Personal Care | 5.29% |
| Career & Employment | 5.77% |
| Dentists & Dental Services | 6.38% |
| Education & Instruction | 10.08% |
| Furniture | 3.77% |
| Health & Fitness | 5.63% |
| Home & Home Improvement | 5.22% |
| Industrial & Commercial | 9.34% |
| Personal Services | 6.51% |
| Physicians & Surgeons | 4.51% |
| Real Estate | 9.53% |
| Restaurants & Food | 18.25% |
| Sports & Recreation | 5.48% |
The industries that convert at the highest rates for Facebook leads campaigns include Restaurants and Food with a CVR of 18.25%, Attorneys and Legal Services with a CVR of 10.53%, and Education and Instruction with a CVR of 10.05%.
Furniture was the industry with the lowest average CVR of 3.77%, followed by Physicians and Surgeons at 4.51% and Home and Home Improvement at 5.22%.
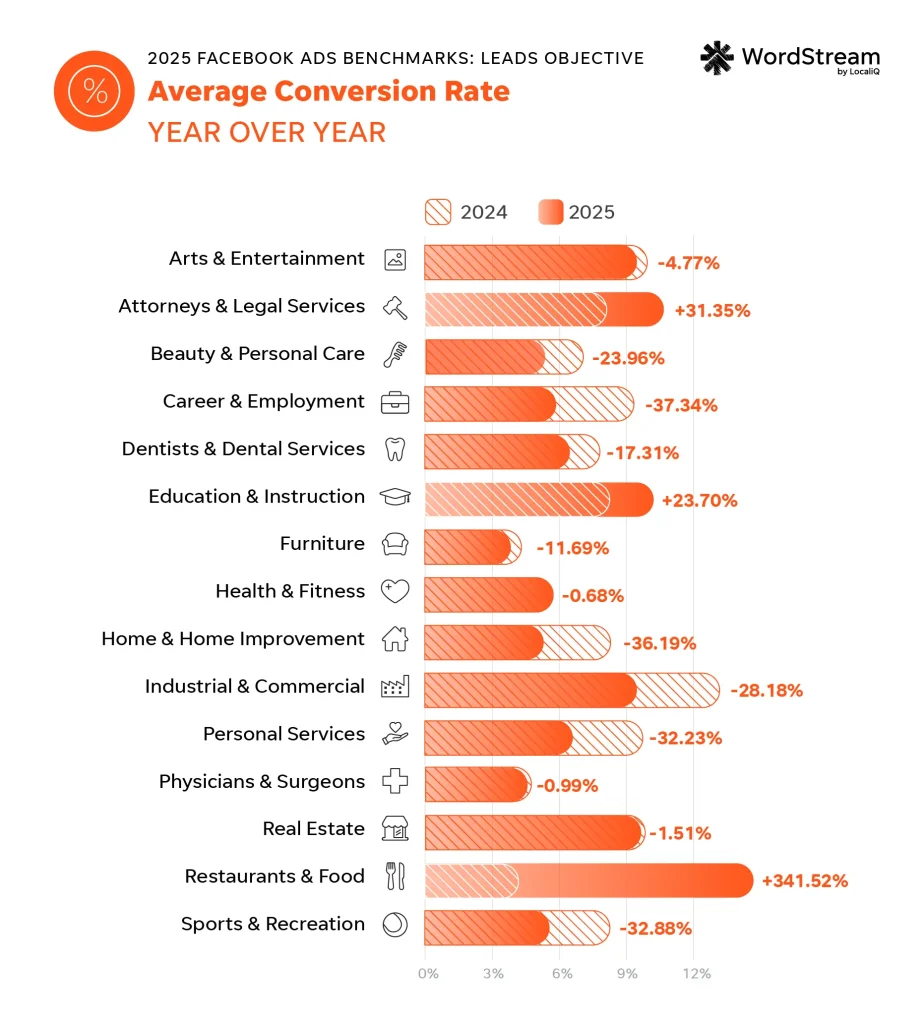
Average conversion rate: YoY
The three industries that had conversion rate increases were Restaurants and Food (up by 341%), Attorneys and Legal Services (up by 31%), and Education and Instruction (up by 24%).
The three industries with the most major decreases in CVR were Career and Employment (down 37%), Home and Home Improvement (down 36%), and Personal Services (down 32%).
Average cost per lead for leads campaigns
Cost per lead is often referred to as the “money metric” in Facebook leads campaign strategies because it indicates how much each new potential customer costs your business.
“The most important metric is the one that aligns the closest with your definition of success. For many businesses looking for leads, CPL is a key metric to watch,” Tyler said.
The average cost per lead in Facebook ads for leads campaigns across all industries is $27.66. This is higher than last year’s overall average of $22.87.
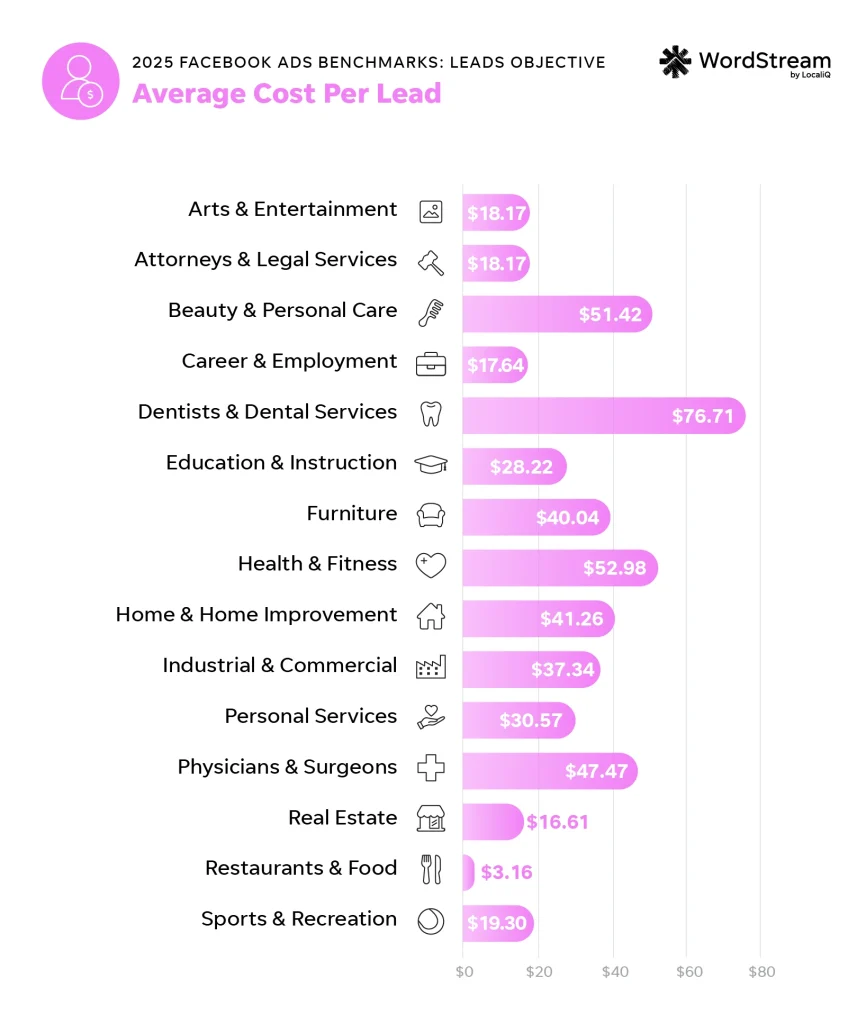
| Business Category | Average CPL |
| Arts & Entertainment | $18.17 |
| Attorneys & Legal Services | $18.17 |
| Beauty & Personal Care | $51.42 |
| Career & Employment | $17.64 |
| Dentists & Dental Services | $76.71 |
| Education & Instruction | $28.22 |
| Furniture | $40.04 |
| Health & Fitness | $52.98 |
| Home & Home Improvement | $41.26 |
| Industrial & Commercial | $37.34 |
| Personal Services (Weddings, Cleaners, etc.) | $30.57 |
| Physicians & Surgeons | $47.47 |
| Real Estate | $16.61 |
| Restaurants & Food | $3.16 |
| Sports & Recreation | $19.30 |
Industries with the highest cost per lead were Dentists and Dental Services ($76.71), Health and Fitness ($52.98), and Beauty and Personal Care ($51.42).
On the other end, industries with the lowest cost per lead were Restaurants and Food ($3.16), Real Estate ($16.61), and Career and Employment ($17.64).
For businesses on the higher end of the CPL spectrum, like Dentists and Dental Services and Health and Fitness, people tend to spend more on these types of services. So, a higher CPL in this case correlates with higher value leads.
“Regardless of the advertising platform, we’re starting to see cost-related metrics rise. CPL is the main metric many businesses look to as a core KPI on Facebook, and it’s gone up by 20% this year. However, just because prices are rising doesn’t mean businesses should necessarily pare down their advertising,” Tyler said.
“In fact, businesses that can afford to remain in the market will become more visible, since a lot of competition tends to pull back on advertising in harsh economic times,” Tyler said.
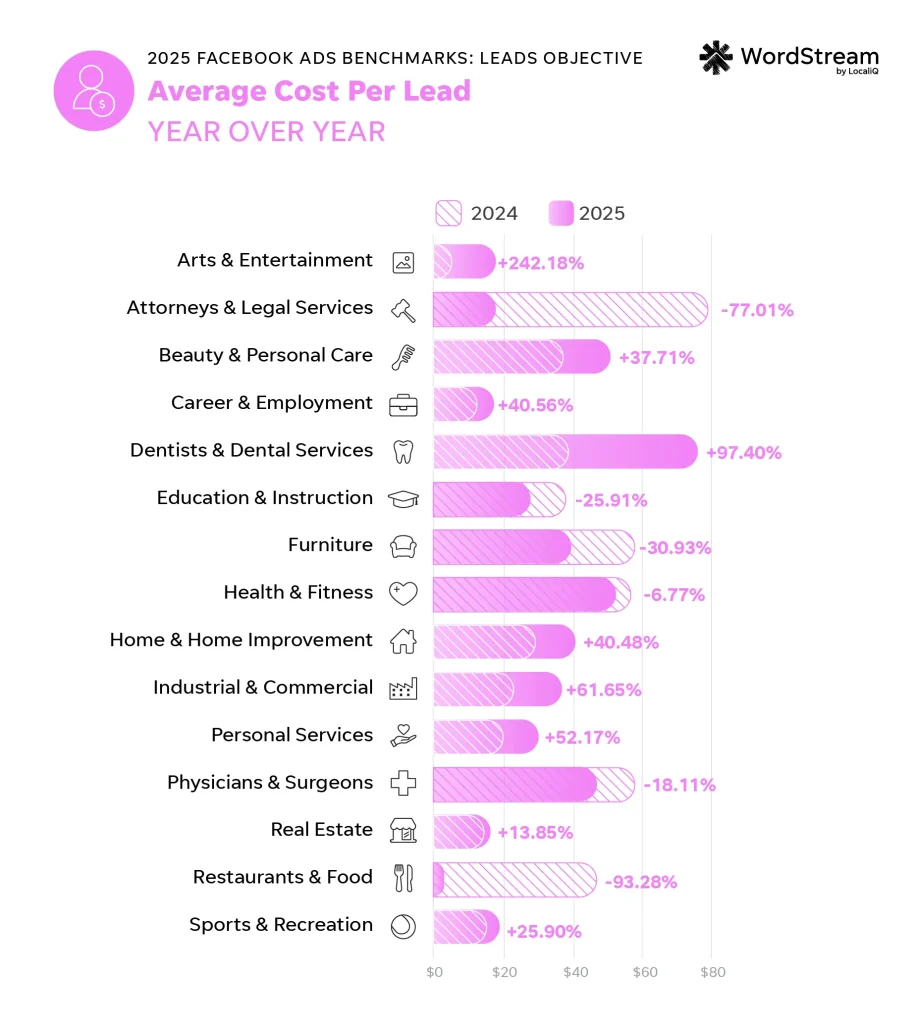
Average cost per lead: YoY
The biggest cost per lead increases year over year were found in industries such as Arts and Entertainment, which increased by 242%, Dentists and Dental Services, which increased by 97%, and Industrial and Commercial, which increased by 62%.
The industries that saw the biggest declines in CPL were Restaurants and Food, down 93%, Attorneys and Legal Services, down 77%, and Furniture, down 31%.
Facebook ads tips for any business
If your Facebook ads results don’t match the data for your industry above, don’t worry. Here are our top tips for how to improve your Facebook ads.
Use Advantage+ carefully (and sometimes sparingly)
Advantage+ is a suite of AI-powered features advertisers can apply to their campaigns, ad sets, and ads. Advantage+ can help streamline your ad creation and targeting. However, there are some pros and cons to be aware of. Using Advantage+ can sway your Facebook ads results if you’re not 100% confident in the data you feed it to help guide and optimize your campaigns.
“You will likely see better metrics in your Meta advertising reports with Advantage+, but who are you actually advertising to? My suggestion is to either use Advantage+ sparingly or have quality control in place to limit the amount of bots that submit forms,” said Brett McHale, founder of Empiric Marketing.
For example, you could have your forms block specific email domains or phone numbers to limit lead spam and keep your lead quality high when implementing Advantage+ targeting.
💡 Incorporating AI into your advertising strategy can be tricky. Find out how to do it right with these 9 powerful ways to use AI in Facebook and Google Ads!
Focus on lead quality over quantity
Speaking of lead quality, you’ll want your lead types to be top of mind when building out your Facebook ads campaigns. Consider your ideal audience members and tailor your ads to them specifically, rather than going after the whole crowd.
“The most important metric for success is who you are driving actions from, or in other words, lead quality. You have to be twice as diligent about targeting and campaign settings to ensure you are targeting the highest quality users possible,” Brett said.
While this tip applies across all campaign objectives, this is especially true for Facebook leads campaigns.
“Traffic campaigns are getting more efficient, which is great to see, but the rise in CPL for Lead Ads shows that getting quality leads is tougher than it used to be. It’s not just about getting clicks anymore, it’s about making sure those clicks actually convert,” said Cliff Sizemore, Senior Marketing Manager at LocaliQ.
Keep your goals top of mind
It can be easy to get lost in the sauce when you’re analyzing specific metrics at a granular level. However, try not to lose sight of your overall Facebook advertising goals. All of the metrics in your account paint a bigger picture of your overall account health when looked at in tandem with one another.
“A single metric does not necessarily determine a campaign’s success. Your business’s advertising outcomes typically depend on your overall objectives,” said Mat Wendler, Senior Manager of Optimization Strategy and Custom Solutions at LocaliQ.
“For instance, you could have a low cost per lead, but the number of qualified leads may still be insufficient, potentially impacting your business’s advertising results. Each metric provides information about the campaign’s performance, and it is the responsibility of the advertiser and their marketing partners to interpret their significance,” Mat said.
So, whether or not a specific metric is doing great or in need of improvement, try to think about how it could be related to other performance indicators and your overall account health.
“It’s incredibly rare that a well-tuned campaign meeting or exceeding benchmarks isn’t providing value for a business. That said, given the fact that most metrics are taking a hit this year due to economic headwinds, it’s more important than ever to scrutinize every data point and ensure marketing dollars are producing more than just good metrics,” Tyler said.
It’s also good to remember here that no two Facebook ad accounts are exactly alike—and what might work for one business might not for another.
“The metric that matters most is the one that ties directly to your goals. All others can be helpful indicators, but the one we need to prioritize over all the others is the main goal,” said Michelle Morgan, Co-Founder of Paid Media Pros.
“For those trying to generate more business sales, that ties directly to conversion rate, cost per lead, and return on ad spend. For those trying to attract and engage new audiences, that’s likely more focused on CTR and CPC. It’s all case dependent, but just because a metric is important to another business owner or marketer, doesn’t mean it needs to be a priority for you,” Michelle said.
Use a mix of campaign objectives
While the leads and traffic objectives are the pillars of most Meta advertising strategies, don’t forget there are a few other campaign objective options. All the different Facebook ads campaign objectives complement each other, so try to include a variety of campaign types in your account.
“Facebook provides a range of advertising objectives. It is a common misconception that advertisers should focus solely on the objective aligned with their final goal. For instance, if the intended outcome is to generate leads, it may be beneficial to consider running branding and traffic campaigns in addition to a lead campaign,” Mat said.
“Small and medium-sized businesses might not have substantial brand recognition, which can impact their ability to attract leads right off the bat. Facebook’s platform offers tools to support both branding and lead generation within a single source,” Mat said.
Testing a mix of campaign objectives and ad types in your strategy also helps you balance out any performance gaps.
“All of these metrics play together, and you have to balance them out for your own goals. The most common misalignment I hear is expecting a high CTR and high CVR, especially for lead generation companies. You’re likely going to see decreasing CTRs (and increasing CPCs) as you focus in on your audience and improve your CVR. This is just part of the lead quality game that we all play,” Michelle said.
“When you’re ad copy testing and looking to drive high-quality leads, don’t be discouraged by lower CTRs. Keep things in a manageable range but be flexible with where your CTR ends up. Be willing to sacrifice a few points here and there to make it up on the back end and in your bank account,” Michelle said.
Prioritize your unique value proposition in ad copy and creative
You want to take users on a journey through your sales funnel when they view and interact with your ads. Focus on engaging and enriching ads that will convey your brand messaging in a unique way.
“It’s better to tell a good story than a perfect one. Consumer demand for authenticity is at an all-time high. As AI becomes more prevalent, it’s important to leverage it in ways to make more meaningful connections with customers. Do not use it just for the sake of using it. Consumers aren’t looking for businesses to cut corners, they are looking for value,” Tyler said.
What these 2025 Facebook ads benchmarks mean for your strategy
Use this industry data as a guideline to inform your strategy. These benchmarks can help you understand how your campaign performance might be pacing against your average competitor. This can be helpful when you want to make confident, data-backed marketing and advertising decisions this year and beyond.
If your results don’t always exactly match up to the averages in your industry, that’s okay! Just be ready to flex and shift your strategy as trends in your industry evolve. And, remember, you don’t have to manage the ups and downs of Facebook advertising all alone. See how our solutions can help transform your strategy into a goal-crushing machine.
About the data
The traffic objective data is based on a sample of 554 US-based search advertising campaigns running between April 1, 2024, and June 30, 2025. Each subcategory includes at minimum 3 unique active campaigns.
The leads objective data is based on a sample of 726 US-based search advertising campaigns running between April 1, 2024, and June 30, 2025. Each subcategory includes at minimum 2 unique active campaigns.
For both objectives, “averages” are technically median figures to account for outliers. All currency values are posted in USD.


