
Table of Links
Abstract and 1. Introduction
-
Background
2.1 Layer-2 Blockchains
2.2 Project Mariana
-
Related Work and Contribution
-
System Architecture
-
Model
5.1 Automated Market Makers
5.2 Price Impact
-
Simulation
6.1 Data and Parameters
6.2 Results
-
Discussion
-
Conclusions, Acknowledgements, and References
Graphs and Tables
6.2 Results

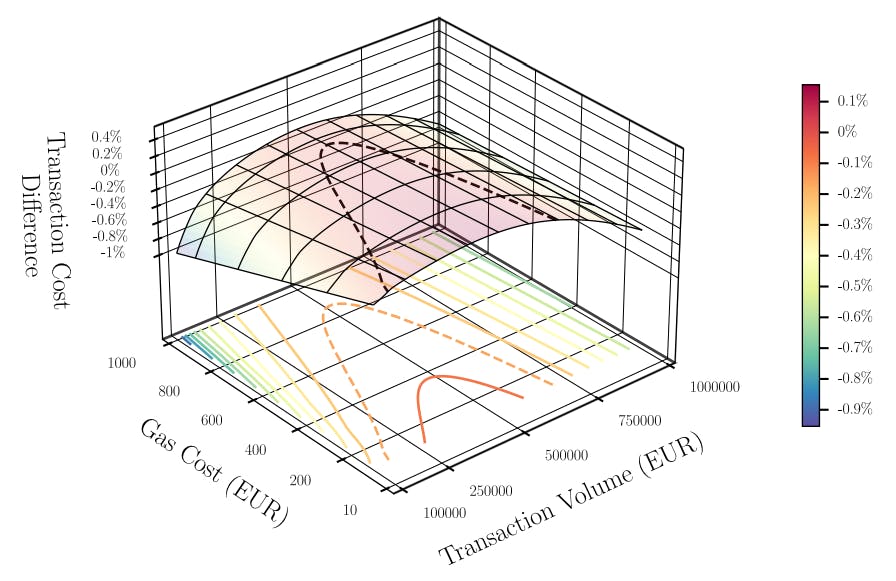

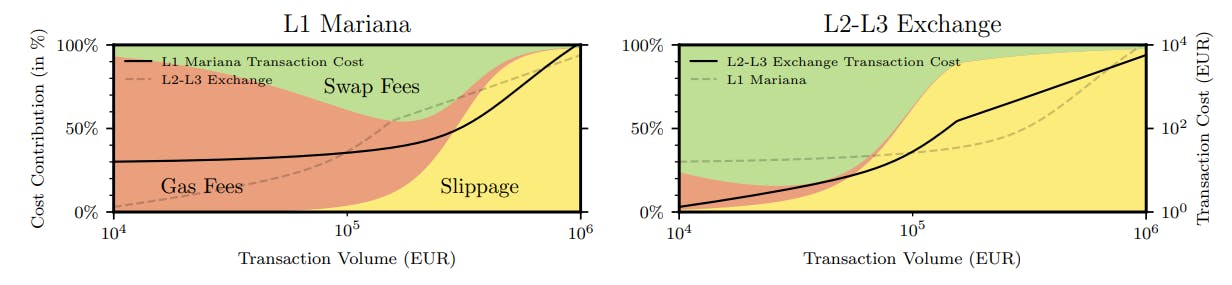


The simulation outcomes are depicted in Figs. 4, 5 and 6. Fig. 8 in the appendix presents the historical total swap costs for transaction volumes of 10k, 100k, and 1mn EUR for CHF for each day over the last 3 years with fixed gas fees. Fig 4 extends this analysis for various gas fees and presents the difference between the costs of L2L3 Exchange and L1 Mariana. Notably, L2-L3-Exchange outperforms for volumes of 10k and 1mn. This outperformance varies, influenced not only by transaction volume but also by current gas fees, as shown in fig. 4. For gas fees surpassing 800 EUR, L2-L3-Exchange outperforms for any transaction volume. For lower gas fees, such as 15 EUR, the out performance range is observed for volumes representing less than 0.01% or more than 0.7% of the provided liquidity. The reason for L2-L3-Exchange outperforming for smaller transactions lies in the minimization of gas fees through the application of L2 and L2s. Fig. 5 breaks down total swap costs, indicating that gas fees dominate the costs for L1 Mariana in smaller transactions, compared to the swap fee for L2-L3-Exchange. For larger transactions, price impact becomes the predominant component of total swap costs.
The outperformance of the L2-L3-Exchange over L1-Mariana and its ability to handle price impact effectively stem from the use of L3 with CLMM, as illustrated in Figs. 6. The analysis of L3 selection indicates the use of L3 with Cryptoswap Invariant 2-token pool for smaller transactions, while the 3-token pool of Cryptoswap Invariant is unused for any transaction volumes. L3 with CLMM and 2-token pool Cryptoswap Invariant outperforms, in certain situations, the 3-token pool of CryptoSwap Mariana despite liquidity fragmentation, with each L3 having three times less liquidity than L1 Mariana. Fig. fig. 5 explains the role of gas, swap, and price impact components in overall transaction costs. The simulation showed that applying more AMMs, despite the liquidity fragmentation, outperforms the application of just one AMM: 100mn to L1- Mariana and 33.33mn to each L3. Fig. 9 simulates the swap costs when various total liquidity is provided.

Authors:
(1) Krzysztof Gogol, University of Zurich ([email protected]);
(2) Johnnatan Messias, Matter Labs;
(3) Malte Schlosser, University of Zurich;
(4) Benjamin Kraner, University of Zurich;
(5) Claudio Tessone, University of Zurich.


