![How to create a social media report [free template included]](https://blog.hootsuite.com/wp-content/uploads/2024/09/social-media-report.png "How to create a social media report [free template included]")
A social media report shows how your social media efforts are performing over a period of time. It helps marketing teams measure progress, improve future strategies, and show the real impact of their work.
It may sound intimidating, but social media reporting doesn’t have to be complicated. Keep reading for tips, tricks, and a free social media report template to set your social strategy on track for success.
Key takeaways
- Regular social media reporting makes it easier to track progress, spot trends, and adjust strategy with confidence.
- Most social media reports include goals, key metrics, performance trends, platform insights, and next steps.
- It can be helpful to break reports down by platform or campaign to see which efforts are driving results.
- Teams often combine platform analytics with reporting tools like Hootsuite to get a 360-view of results.
A social media report is a document with an in-depth analysis of your social media marketing performance over a specific period.
Social media reports help you track your key performance indicators (KPIs), measure the success of your social media campaigns, and identify opportunities for optimization.
For instance, a report on your brand’s Instagram account might reveal that your followers comment more on videos than they do on photos. You might learn that your Instagram Reels are achieving a wider reach than your Instagram Carousel posts.
In other words, each data point will help you and your team identify patterns. And with these patterns, you’ll be better equipped to serve your audience more of what they like, online and offline.
TL;DR: A well-crafted social media report can provide valuable insights into your efforts and help contribute to better decision-making.
#1 Social media tool
Create. Schedule. Publish. Engage. Measure. Win.
Free 30-day trial
Social media reports help marketing teams understand what’s working across social media, and whether those efforts are paying off.
They make it easier to:
- Show ROI: Connect the dots between social media activity and real business outcomes.
- Make data-driven decisions: Use performance data to guide strategy, campaigns, and budget.
- Align teams: Give marketing, social, and leadership a shared view of performance.
- Spot trends: Identify patterns in audience behavior and content performance.
- Track progress: Measure results over time and test performance against goals.
Ultimately, social media reports turn raw data into clear takeaways that support smarter planning and strategies.
A social media report should include performance metrics, insights, and context to explain results.
Most reports cover:
- An executive summary
- Social media objectives
- Period-specific goals
- Metrics and KPIs
- Performance analysis
- Campaign insights
- Competitor analysis
- Audience insights
- Content analysis
- Platform performance
- Recommendations
That said, every social media marketing report is going to be a little different, depending on your business’s unique social media goals. The list below is more of a suggestion than a rule.
Executive summary
Many social media reports start with a brief overview of the report’s findings and highlights. This is a snapshot of your social media performance — a few sentences that summarize the details that are covered later in the report.
Social media objectives
A quick overview of your social media strategy provides context, reminding readers of what you’re trying to accomplish. Does your company use social primarily as a channel for customer service? Social commerce? Brand awareness? All of the above?
Be sure to highlight any changes in strategy since the last time you reported, including any new channels you’ve incorporated into your social mix.
Period-specific goals
Outline the goals you were hoping to accomplish during the reporting period — whether it’s audience growth or gathering insights from social listening. This lets everyone reading the report understand what “success” specifically means.
Metrics and KPIs
Present the social media KPIs that you’re tracking. It probably goes without saying, but these metrics should align with your goals (above). Specific metrics you might want to highlight include engagement, click-through rate (CTR), reach, followers, website clicks, or conversion rates.
Performance analysis
This is what most people are interested in. To analyze your performance, you’ll want to review how your metrics and KPIs stack up against your stated goal. Identify trends, successes, and areas that need improvement.
Campaign insights
If you ran specific campaigns over the reporting period, create a separate segment to share insights about their performance. What worked well? What could be tweaked for next time?
Competitor analysis
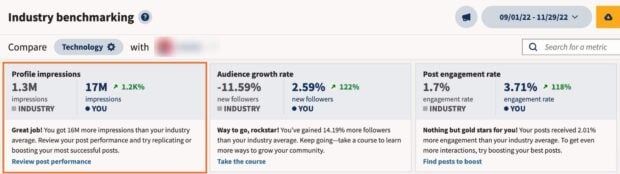
Consider including a competitive analysis to benchmark your performance against other brands in the industry.
At this point, you probably have a sense of how your accounts have grown or changed over the weeks or months, but comparing your performance to your peers can provide some interesting insight as well.
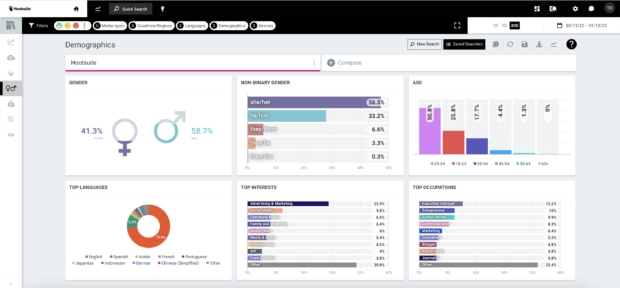
Audience insights
Share up-to-date demographic information about your target audience. Who are your followers? Where are they from? How old are they? What else do we know about their interests and behavior?
Understanding who is consuming your content allows you to tweak your content strategy accordingly.
Content analysis
There may be interesting insights to glean from the type of social media content that’s trending (or underperforming). Evaluate the performance of different types of content — text, images, videos, and so on.
Identify which content resonated the most with your audience.
Platform performance
If you’re active on multiple platforms, assess the performance of each one in this section. Different social networks may require unique strategies — your TikTok stats and your Instagram stats could tell two totally different stories.
Recommendations
Based on your analysis and findings, suggest actionable recommendations for future campaigns or the next reporting period.
Want to skip the setup? Our free social media report template includes pre-built sections for goals, KPIs, insights, and recommendations.
Creating a social media report involves setting goals, selecting the right metrics, analyzing performance data, and then presenting next steps. At a high level, the process looks like this:
- Determine the audience for the social media report
- Set clear goals and objectives
- Choose relevant metrics
- Gather data
- Analyze performance
- Create visuals
- Compare your data with previous periods
- Share audience insights
- Provide competitive analysis
- Create a campaign evaluation
- Make recommendations
Step 1: Determine the audience for the social media report
Is the social media report for the sales team, or to get the new marketing interns up to speed? Is it for shareholders? Are you sharing this with the general public?
Understanding who is reading the report will help shape what information goes in it – and sometimes, less is more.
Step 2: Set clear goals and objectives
Begin by defining the objectives you want to achieve through your social media efforts. Then, break that down into smaller, more time-specific goals.
It’s a good idea to use the SMART goal-setting framework, which helps you create goals that are easier to track and report.
To make sure your goals are realistic, base them on benchmarks specific to your industry and the social platforms you’re active on.
For example, knowing that the average Instagram engagement rate in financial services is 5% will put your past performance and future goals in perspective…

… as will knowing the follower growth rate:

Step 3: Choose relevant metrics
Once you’ve settled on your goals, it’s time to decide just how you’ll measure your progress towards them.
For instance, if your goal is to reach a younger demographic, increasing your follower count on TikTok could be a great objective – and that’s an easy metric to track.
The metrics that matter will be different for every marketing team, but some key overall metrics to include are:

If you’re using social media for customer service, it’s also a good idea to report on service metrics like net promoter score (NPS), customer satisfaction score (CSAT), ticket resolution time, and retention.
Of course, you can include much more data if it’s relevant to your objectives. For a full breakdown of all the numbers you can include in your social media business report, check out our post on the social media metrics that really matter.
Step 4: Gather data
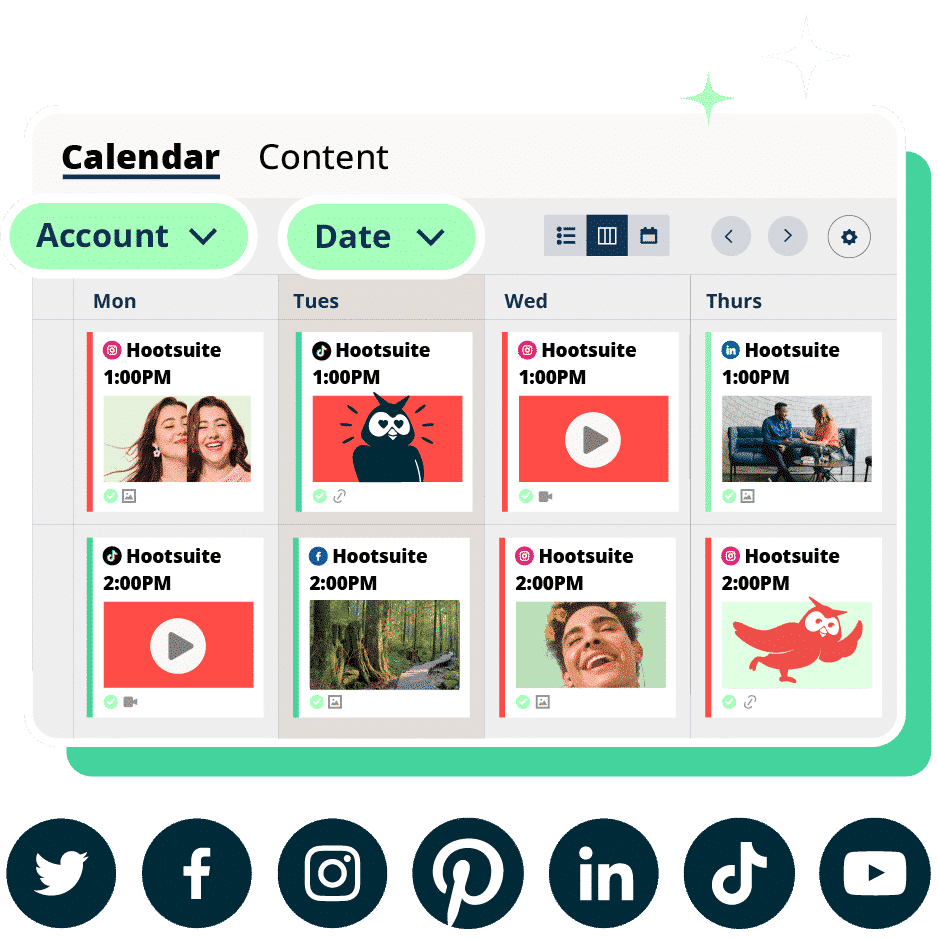
Collect data for the reporting period. Most social media platforms offer built-in analytics, but you can also use a third-party tool for a more comprehensive analysis, like Hootsuite Listening.
If it makes sense for your team, you can get even more specific and break things down by format, such as Stories vs. posts vs. Reels.
No matter what metrics you choose, include data from previous weeks, months, or years so you can compare your performance later in the report. After all, data means nothing in a vacuum.
Step 5: Analyze performance
Now it’s time to analyze your performance and form conclusions or insights.
What can you learn from your top-performing posts? What content and strategies contributed most to your success, and which underperformed?
It’s also important to look beyond quantitative metrics. Maybe you made contact with a key social media influencer for the first time. Or, maybe a compelling review came in through social that you can use in future marketing campaigns.
Include room in your social media report to share all forms of success that are relevant to your goals.
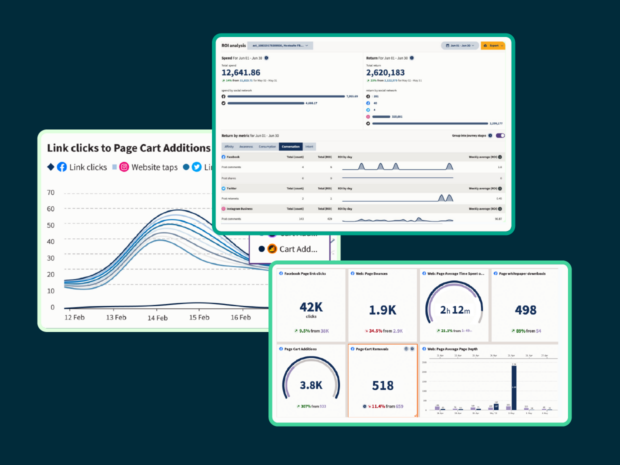
Step 6: Create visuals
Visualize your data using graphs, charts, and tables. (Psst: Hootsuite can generate these sorts of things for you!)
Visuals make it easier to understand complex information and trends at a glance. Google Sheets can quickly generate charts and visuals, and Canva is another easy design tool to use.
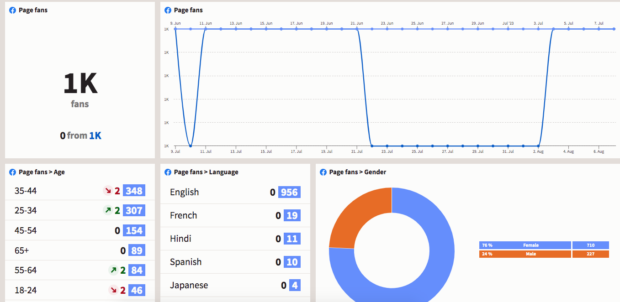
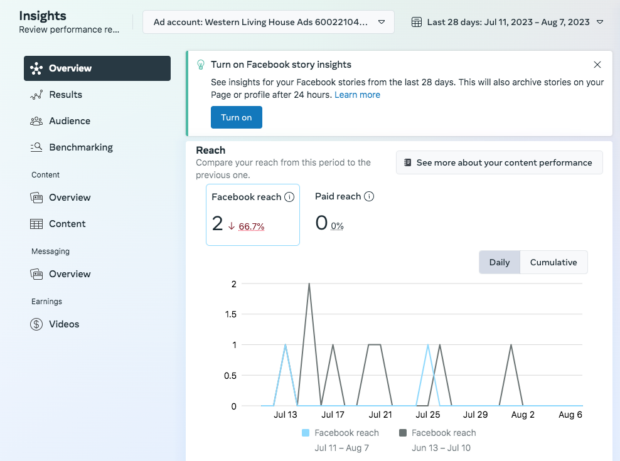
Step 7: Compare your data with previous periods
At this stage, you’re looking at how current results stack up against previous reporting periods, like last month, last quarter, or the same time last year.
Comparing performance side by side helps you spot trends and understand where you’ve improved (or, gulp, regressed). It also adds important context, helping you account for seasonality, campaign cycles, or changes in audience behavior.
For example, a dip in engagement during the summer might reflect a predictable slowdown rather than a problem with your content or strategy.
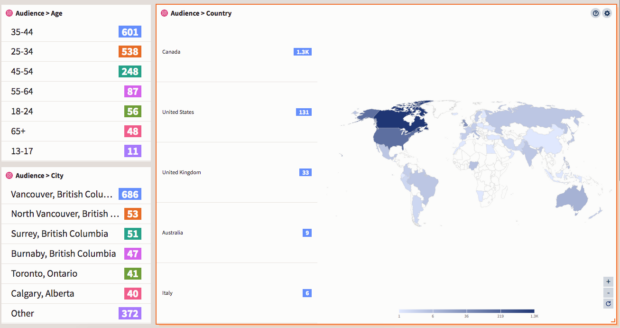
Step 8: Share audience insights
Pull information about your audience demographics, interests, and behaviors, and share these in your social media report.
Who is your average follower at this specific moment in time? When are they online, and what do they do there?
You can find this information in most platforms’ internal analytics, but social media dashboards like Hootsuite can help pull info from multiple platforms together in one spot.
Step 9: Provide competitive analysis
Pull some recent data about your competitors and industry — where are companies thriving or struggling? This info can help you benchmark your own performance.
Direct competitors are great to watch here, but it might also be helpful to keep track of non-industry accounts that you admire, too. There’s plenty to be learned from other brands who might be courting the same type of audience.
Step 10: Create a campaign evaluation
Chances are, at some point or another, you’re going to be running a specific campaign (whether organic or paid) with the hopes of making a particular impact. If you’ve invested money or time into one strategic campaign, it’s time to evaluate its effectiveness.
Did your ad blitz totally falter on Facebook, but thrive on Pinterest? Did you nail it with your target demographic for your Instagram Stories ads? Determine what aspects led to success and what can be improved in future campaigns.

Step 11: Make recommendations
Now that you’ve soaked up all this data, it’s time to make some educated suggestions on what should happen next.
Does your team need to invest in some targeted social ads to improve your reach? Should you double down on creating TikTok videos?
Provide actionable recommendations for future campaigns, whether that means suggesting content ideas or adjusting posting schedules.
There are several types of social media reports, each designed for a different purpose. Here are a few common types:
- Monthly performance reports
- Quarterly performance reports
- Campaign-specific reports
- Platform-specific reports
Monthly performance reports
As you might’ve guessed from the name, monthly social media reports provide a snapshot of your performance over a month. They are useful for tracking short-term goals, and allow you to make adjustments to strategy in real-time.
Quarterly performance reports
Quarterly reports offer a more comprehensive analysis of your performance over a quarter. These types of social media reports provide a broader perspective and help your team identify long-term trends.
Campaign-specific reports
It’s a good idea to report on and track campaign metrics in your broader social media reports, but you might find it useful to create a dedicated campaign report. With a hyper-focused review like this, you’ll be able to offer detailed insights into its success and areas for improvement.
Platform-specific reports
Each social media platform has its own unique dynamic, so you may find it tricky to review the nuances in one generalized report. That’s where platform-specific social media reports come in. For businesses active on multiple platforms, creating platform-specific reports allows you to tailor your analysis more precisely.
There you have it: everything you need to know to create a winning social media report.
Short on time? Give yourself a headstart with a ready-made reporting template.
Our free social media report template helps you:
- Write an effective intro
- Summarize insights clearly for stakeholders
- Present next-step recommendations
You can create social media reports using in-platform analytics and third-party reporting tools.
Many teams use a mix of:
- In-platform analytics
- Social media management tools, and
- Web analytics tools
The right tool depends on your reporting needs, scale, and level of detail. Here are some of the best tools available:
1. In-platform analytics tools
Whether you’re diving into your Instagram numbers or your LinkedIn data, social media platforms feature an in-house analytics platform that will shed light on your performance.
Learn more about each of the social media platforms’ analytics tools here:
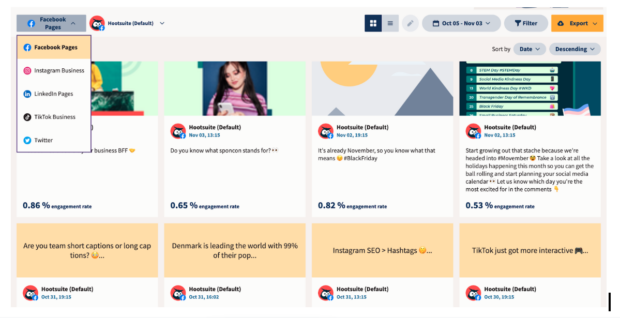
2. Hootsuite Analytics
Hootsuite Analytics is a social media analytics tool that lets you easily track the performance of all your social channels in one place, including Facebook, Instagram, X (formerly Twitter), LinkedIn, TikTok, and Bluesky.
The tool also makes it easy to create custom reports to showcase your results to your boss and share insights with your team.
From a single dashboard, you can track metrics like:
- Reach
- Engagement rate
- Impressions
- Likes
- Plays
- Shares
- Clicks
- Saves
- Comments
- Video views
- New followers
- Total followers
- Profile visits
- Reactions
- Negative feedback rate
- Website clicks
- Average time watched
- Number of messages, calls, and emails
- Daily engaged users
- And much more
You can set up custom boards that give you an overview of your most important metrics at a glance, or dive into more granular information, down to individual post performance.
With Hootsuite Analytics, you can also:
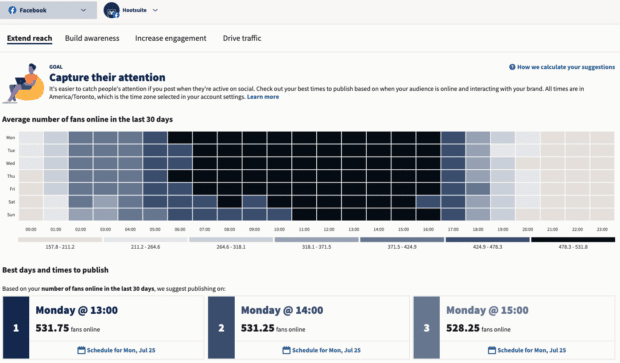
- Find out when your audience is online
- Get personalized recommendations for your best times to post for each of your accounts
- Easily view industry benchmarks and see how you compare to competitors

Always post at the right time
Find out when your audience is online and optimize your posting schedule for maximum engagement. It’s so easy.
Start free 30-day trial
3. Talkwalker
Talkwalker leads the industry in social data intelligence.
Leveraging artificial intelligence, it delivers actionable insights from real-time social media monitoring and sophisticated analytics.
Define and categorize conversations that matter using over 50 filters, and make informed decisions on how to engage with your audience.
To get more details on how to make the most of the data available through all of these social reporting tools, check out our blog post dedicated to social media analytics.
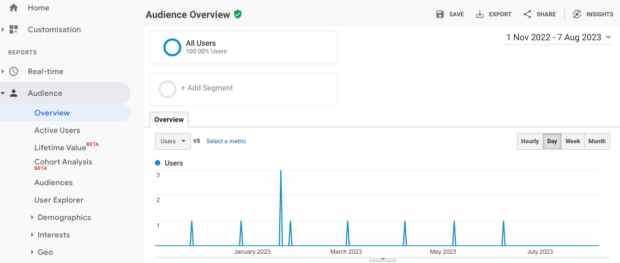
4. Google Analytics
Google Analytics is a powerful web analytics tool offered by Google that provides valuable insights into website and app performance, and can even help track social media traffic.
It’s widely used by businesses, marketers, and website owners to track and measure user interactions, analyze traffic sources, and gather data to optimize online presence.
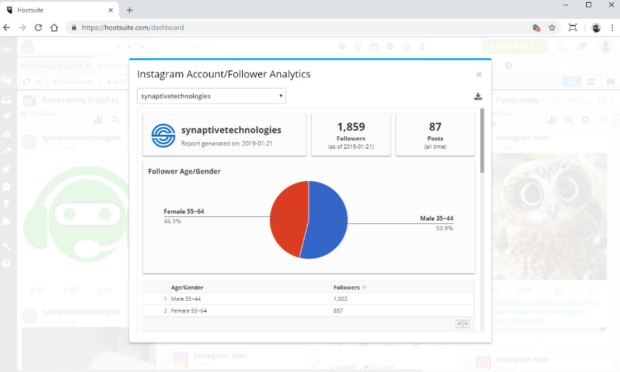
5. Panoramiq Insights
Seamlessly integrating with Hootsuite, Panoramiq Insights allows you to conveniently access crucial Instagram metrics directly from your dashboard.
The tool offers comprehensive analytics for your entire range of Instagram actions, spanning posts, Stories, and Reels. It also keeps a pulse on user information, from follower demographics to new follow interactions.
FAQ: Social media reports
What is a social media report and what should it include?
A social media report is a summary of how social media is performing over a set period of time. It typically includes goals, key metrics, performance trends, audience and content insights, and clear recommendations for what to do next.
How do you create a social media report for executives?
The best way to create a social media report for executives is to focus on outcomes, not just metrics. Executive reports should include progress toward goals, key trends, business impact, and a short list of insights or decisions that matter most.
Which social media metrics matter most in enterprise reporting?
The most important social media metrics for enterprise reporting are the ones tied to business goals These often include engagement, reach, follower growth, traffic, conversions, and return on investment, depending on your team’s priorities.
How often should enterprises create social media reports?
Most enterprises create social media reports on a regular cadence, such as monthly or quarterly. Monthly reports help teams stay on top of performance, while quarterly reports are better for spotting bigger trends and adjusting your marketing strategy accordingly.
What tools help automate social media reporting?
Social media reporting tools help automate data collection, reporting, and visualization. Tools like Hootsuite pull data from multiple social networks into one place, surface key trends, and create easy-to-read reports.
Use Hootsuite to do all your social media reporting from a single dashboard. Choose what to track, get compelling visuals, and easily share reports with stakeholders. Try it free today.


