Table of Links
Abstract and 1 Introduction
1.1 Related literature
-
Types of Metrics and Their Hypothesis and 2.1 Types of metrics
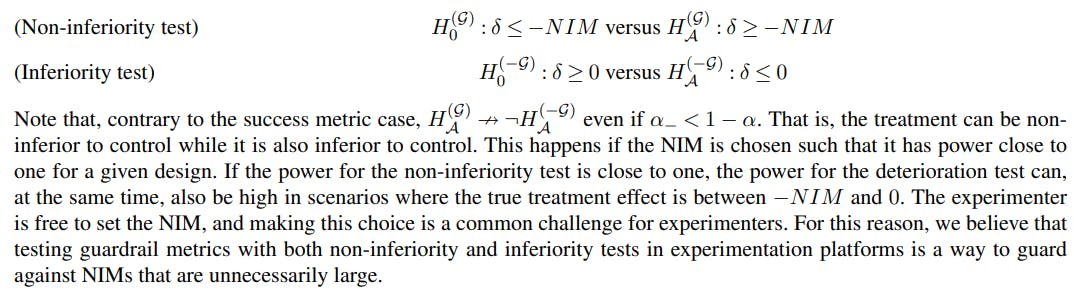
2.2 Hypotheses for different types of metrics
-
Type I and Type II Error Rates for Decision Rules including Superiority and Non-Inferiority Tests
3.1 The composite hypotheses of superiority and non-inferiority tests
3.2 Bounding the type I and type II error rates for UI and IU testing
3.3 Bounding the error rates for a decision rule including both success and guardrail metrics
3.4 Power corrections for non-inferiority testing
-
Extending the Decision Rule with Deterioration and Quality Metrics
-
Monte Carlo Simulation Study
5.1 Results
-
Discussion and Conclusions
APPENDIX A: IMPROVING THE EFFICIENCY OF PROPOSITION 4.1 WITH ADDITIONAL ASSUMPTIONS
APPENDIX B: EXAMPLES OF GLOBAL FALSE AND TRUE POSITIVE RATES
APPENDIX C: A NOTE ON SEQUENTIAL TESTING OF DETERIORATION
APPENDIX D: USING NYHOLT’S METHOD OF EFFICIENT NUMBER OF INDEPENDENT TESTS
Acknowledgments and References
APPENDIX A: IMPROVING THE EFFICIENCY OF PROPOSITION 4.1 WITH ADDITIONAL ASSUMPTIONS
It is possible to improve the efficiency by making assumptions that makes the inferiority test rejection region not overlap with the rejection region of the superiority or non-inferiority test, respectively, for success metrics and guardrail metrics. In the sections below, we describe how deterioration tests affect the type I and type II error rates for superiority and non-inferiority tests and under what conditions the rates are not affected. We then use this information to update Proposition 4.1.
A.1 Type I and type II error rates for a success metric with superiority and deterioration tests
To be specific about the consequences of testing a success metric with an additional deterioration test, we require some new notation. We focus on a single success metric and how this metric contributes to the shipping decision. There are now two tests and four hypotheses for the success metric, defined as:


The deterioration test is here an inferiority test that mirrors the main superiority test, but with the hypotheses reversed. Because of these two tests, there are now two possible false positive results for this metric: a false positive inferiority test, and a false positive superiority test. The false positive risk in terms of the shipping decision for a set of success metrics with superiority and inferiority tests is given by the probability that the superiority test rejects the null hypothesis while, simultaneously, the inferiority test does not. The additional criterion of non-significant inferiority tests can only make the superiority test more conservative, i.e., reduce the false positive rate and the true positive rate of the shipping decision. However, it is easy to restrict the rejection regions of the deterioration test and the superiority test such that the deterioration test cannot affect the rejection rate of the superiority test under any hypothesis. Lemma A.1 formalizes this.


Lemma A.1 says that if the same test statistic is used for the superiority test and the deterioration test, and α_ < 1− α, the rejection regions cannot overlap. This is somewhat trivial for the success metric case. In the next section, we present similar results for guardrail metrics with non-inferiority and deterioration tests.
A.2 Type I and type II error rates for a guardrail metric with non-inferiority and deterioration tests
For guardrail metrics, we can reason analogously to the success metrics case, but there are additional nuances due to the potential overlap between rejection regions of the deterioration and non-inferiority tests. There are four relevant hypotheses given by


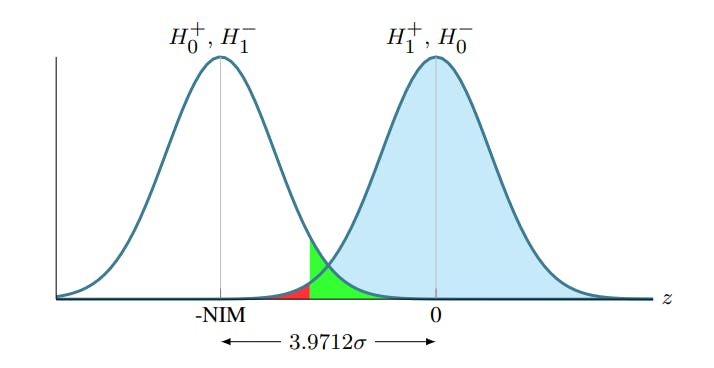
The fact that β ≥ α− is a sufficient additional criterion for the rejection regions to not overlap in the non-inferiority case is perhaps most easily seen graphically. Figure 2 displays the relation between the regions when β = α_. From the figure it is clear that the regions would overlap for a fixed β if α_ increases. Analogously, a decrease in β would make the regions overlap for a fixed α_. Note that as long as α_ ≤ 1 − α+, the value of α+ does not affect the overlap. This follows since if α+ changes, the implied NIM for which the non-inferiority test has power 1 − β changes accordingly.


A.3 An updated version of Proposition 4.1
Here we improve the α and β corrections slightly by enforcing non-overlapping rejections regions.


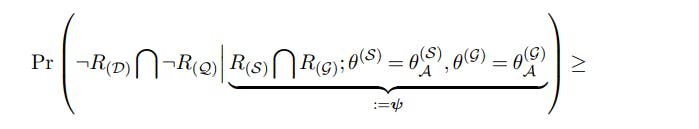
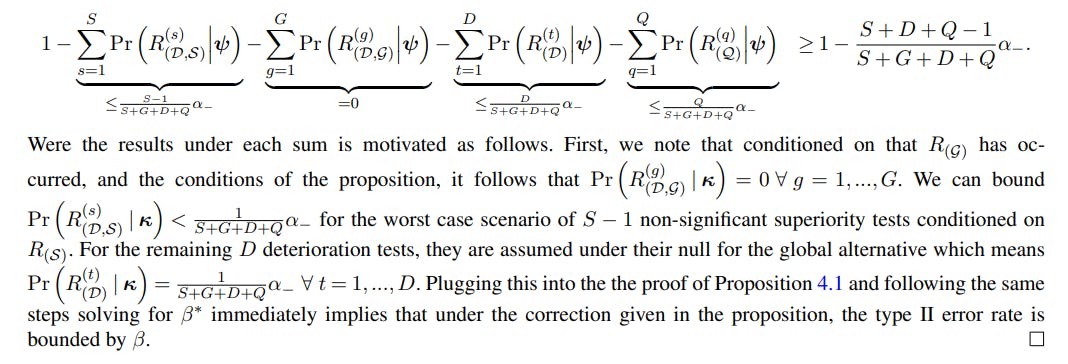
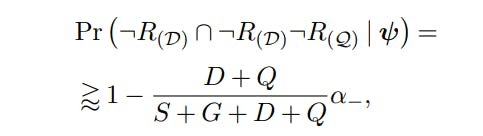
PROOF. The proof is almost identical to the proof of Proposition 4.1. Now we have under the global null

Which implies

We can adjust our correction of α to make the test less conservative by solving


which implies that we should correct α according to


to minimize the conservativeness without any assumptions on the data generating process.
for the type II error rate we follow the proof of Proposition 4.1 closely. The only changes are that


A.4 Additional approximate improvements
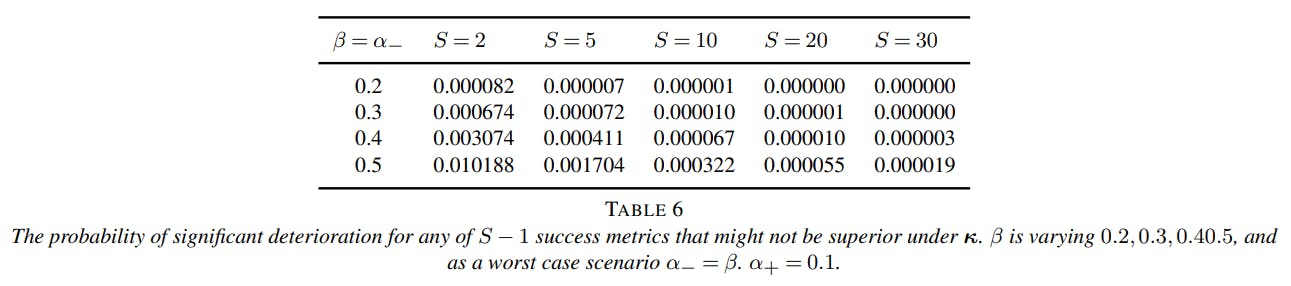
The β correction in the updated Proposition bounds the type II error rate under a quite extreme worst-case scenario. This is because under the alternative, and given that at least one success metric has improved, the probability that any of the remaining success metrics is significantly inferior is very low. In fact, the probability is so low that it is usually negligible. We formalize this in Remark A.1.


from which the remark follows immediately from the previous proof.
Authors:
(1) Mårten Schultzberg, Experimentation Platform team, Spotify, Stockholm, Sweden;
(2) Sebastian Ankargren, Experimentation Platform team, Spotify, Stockholm, Sweden;
(3) Mattias Frånberg, Experimentation Platform team, Spotify, Stockholm, Sweden.


