Authors:
(1) SIMONE CASALE-BRUNET, École Polytechnique Fédérale de Lausanne, Switzerland;
(2) MIRKO ZICHICHI, Universidad Politécnica de Madrid, Spain;
(3) LEE HUTCHINSON, WhaleAnalytica.com, Switzerland;
(4) MARCO MATTAVELLI, École Polytechnique Fédérale de Lausanne, Switzerland;
(5) STEFANO FERRETTI, University of Urbino “Carlo Bo”, Italy.
Table of Links
1 Introduction
2 State of Art
3 Projects Selection and Data Collection
3.1 Blockchain data
3.2 Twitter data
4 Data Analysis and Results
4.1 Ethereum wallets and Twitter users and 4.2 The communities
4.3 Hashtags
4.4 The role of the social network community
5 Conclusions and References
As a further point of analysis, we focused on hashtags and how they are used in tweets. The hashtags – that are words preceded by the # symbol such as #NFT – are in fact the most common method used by Twitter users to create


specific groups and streams of communication. We identified 60,060 different hashtags and thus constructed a weighted undirected graph where: each node represents a hashtag and each connection between two nodes represents the presence of a tweet in which both corresponding hashtags were used. As the weight of each node was assigned the number of tweets in which the corresponding hashtag was present, and as the weights of each connection the number of tweets having the two corresponding hashtags in common. Figure 6a illustrates in descending order which are the 20 most used hashtags: NFT, cryptopunks, and BAYC are the most significant ones. Beyond the 20th, namely art, the weights are much lower. Overall, the properties of the graph thus formed are shown in Table 3a: the graph consists of 762,950 connections, with an average weight of about 29,634 common tweets. The average clustering coefficient and the relatively significant number of connected components (that is 439) suggest the presence of highly specialized communities within this content graph. However, edge density is extremely low in this case, being hashtags mainly connected with some central hashtags (see below). Most likely for this reason, modularity has a low value. While


Figure 6b illustrates in descending order which are the 20 hashtags with highest pagerank. Again, the values beyond the 20-th (famorie, related to the CryptoMories) the weight is much lower. Figure 4b illustrates the graph taking into account only these 20 hashtags, where the size of the nodes is proportional to the pagerank: again, as can be observed, the hashtags NFT, cryptopunks and BAYC are the most in”uential. We also performed a commonality analysis for the hashtags: this was summarized in Table 3c. As can be observed, the NFT hashtag is the one that is most common to all. The hashtags nftart, nftartist, and nftcollection are neither close to cryptopunks nor BAYC: this indicates how for more generic topics, and not only related to PFP, the discourses are less polarized on cryptopunks and BAYC.
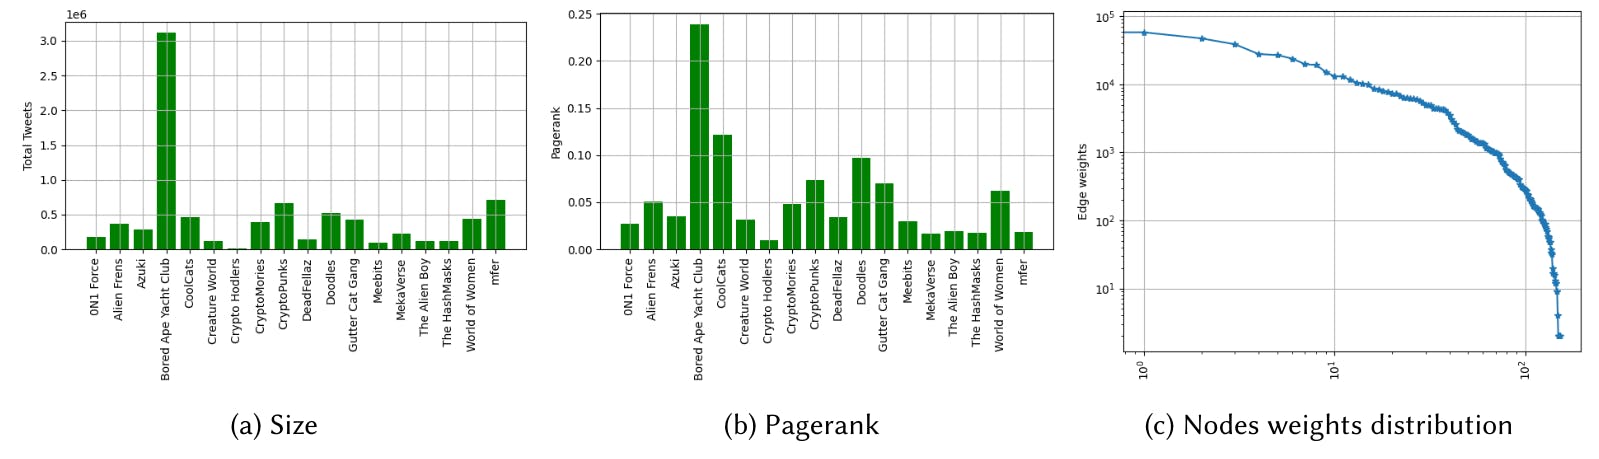
Figure 7 shows trends in volume, average price, tweets, and users (wallets and Twitter accounts) for a number of very different projects from the date of creation until April 14, 2022. BAYC, CryptoHodlers, Mekaverse, and mfers were considered. As can be seen, the BAYC built up a continuous engagement on Twitter where within a year the number of unique users talking about them grew exponentially, as did the average price, which went from 0.08ETH to more than 100ETH in less than a year. There are projects, such as CryptoHodlers, on the other hand, where although the creators try to build an ecosystem around their project by distributing comics or developing a new reserved NFT, the community has not grown, impacting the average price and liquidity (in terms of daily trades) of this project. Mekaverse and mfers, summarize these concepts: for the former we see how a high number of tweets in the early stages of the project resulted in an initial high exchange value where the figurines traded for a minimum price of 8ETH, then went to 10 times less as the number of tweets dropped. For the latter, on the other hand, we see that engagement in terms of daily tweets coincides with an increase in average price, and this occurs gradually and constantly after their release.


