Table of Links
Abstract and I. Introduction
-
Materials and Methods
2.1. Multiple Instance Learning
2.2. Model Architectures
-
Results
3.1. Training Methods
3.2. Datasets
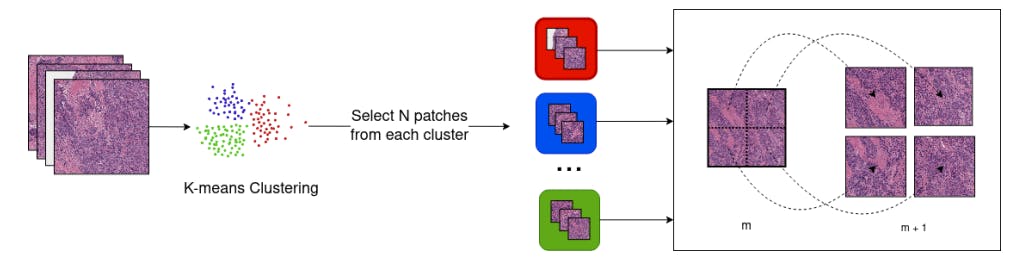
3.3. WSI Preprocessing Pipeline
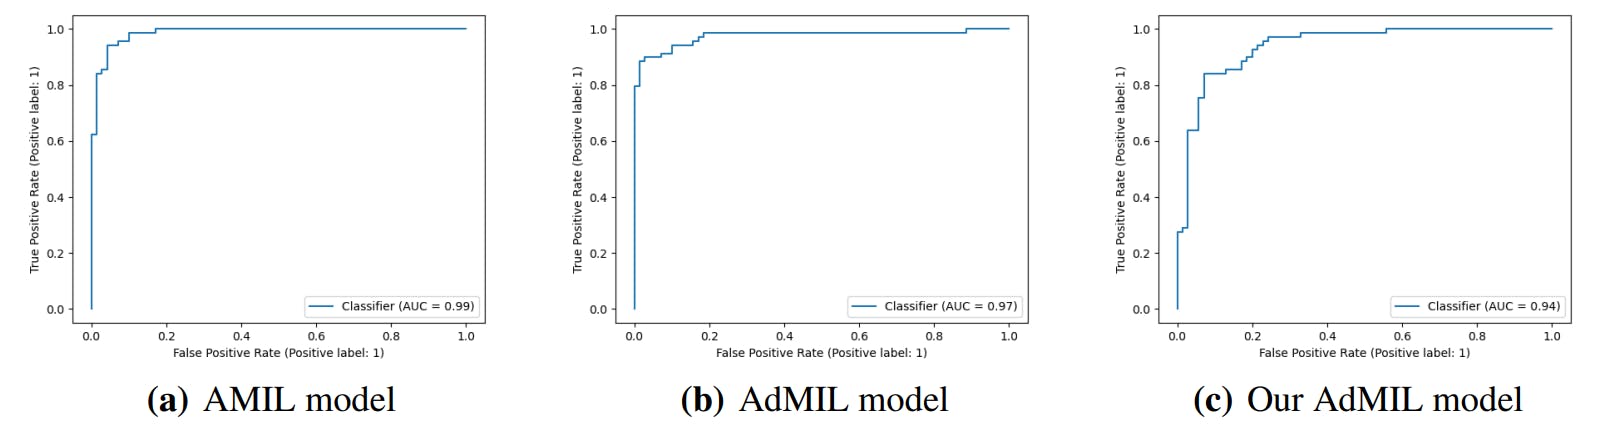
3.4. Classification and RoI Detection Results
-
Discussion
4.1. Tumor Detection Task
4.2. Gene Mutation Detection Task
-
Conclusions
-
Acknowledgements
-
Author Declaration and References
3. Results
3.1. Training Methods
We split each dataset into a training set (80%) and test set (20%). For each task and model, we performed 5-fold cross-validation on the training set in order to prevent overfitting. The test set was then used for external validation, with the model extracted from the fold that obtained the best results.
For all the models, the loss function used was the binary cross-entropy loss, defined as


where 𝑌 is the positive class. For optimization of the loss, we used the Adam optimiser. For some of the models, we employed a cosine annealing learning rate scheduler.
3.2. Datasets
We chose two projects from TCGA (The Cancer Genome Atlas) [22] to be analyzed in this work: TCGA-BRCA (Breast Invasive Carcinoma) and TCGA-LUSC (Lung Squamous Cell Carcinoma).
For the tumor detection task, we only used flash-frozen slides. Even though frozen specimens are less suitable for computational analysis when compared to formalin-fixed paraffin-embedded (FFPE) slides, we decided to build our dataset with these because of the lack of FFPE slides in the TCGA containing only healthy tissue. For this task, we focused on 5x magnification tiles, since this is the magnification level that pathologists typically use when searching for tumors.
For gene mutation detection, we used FFPE Slides, since the unbalanced distribution was no longer a problem and these slides provided better results and training performance. Furthermore, the feature extractor we used for the tiles, Kimianet [18], was trained with FFPE slides, so conforming to the same would lead to better results. For this task, we built three datasets at three different magnification levels: 5x, 10x, and 20x, in order to better understand at which magnification the models could best detect correlations between the mutation and the morphology of the tissue.
Due to the large size of FFPE slides and to save storage space and time, we performed a random sampling of tiles for these slides, depending on the magnification level. Moreover, while slide-level tumor presence labels were available for the first task, gene expression labels are only available at case-level (patient-level), presenting some challenges. We assumed that not only will the mutation be present in all diagnostic slides from a patient labeled as positive, but also that it would cover enough tissue to be captured in the tiles sampled in our dataset.
3.2.1. TCGA-BRCA
The TCGA-BRCA is composed of 1098 cases. It contains 1133 FFPE Slides and 1978 flash-frozen slides across those cases. This dataset was used for the gene mutation task. We focused on the mutations of the TP53 gene since this gene shows a greater number of mutated cases from those tested for simple somatic mutations (331 of 969 cases), allowing us to build a balanced dataset. For this task, we have 349 positive slides and 670 negative slides. We chose an equal number of positive and negative WSIs, and after filtering inadequate slides through the processing pipeline, we ended up with a total of 662 slides, 331 labeled positive and 331 labeled negative.
3.2.2. TCGA-LUSC
The TCGA-LUSC is a dataset for lung squamous cell carcinoma. The size of this dataset is fairly small when compared with TCGA-BRCA, with 504 cases, containing 512 diagnostic slides and 1100 tissue slides across those cases. For the tumor detection task, we have 753 positive slides and 347 negative slides. Its class distribution for the tumor detection task is not too imbalanced for our purposes. We chose an equal number of positive and negative slides, ending up with a dataset composed of 694 slides. Its reduced number of slides, as well as the presence of more artifacts makes this type of cancer more challenging to work with. The TCGA-BRCA slides always have a tumor percentage of 90% at least, while in the case of TCGA-LUSC, the distribution of tumor percentage is more balanced. Therefore, we decided that for this task, a dataset built with slides from TCGA-LUSC is preferable for validating the ability of the model to generalize with different slides.
Authors:
(1) Martim Afonso, Instituto Superior Técnico, Universidade de Lisboa, Av. Rovisco Pais, Lisbon, 1049-001, Portugal;
(2) Praphulla M.S. Bhawsar, Division of Cancer Epidemiology and Genetics, National Cancer Institute, National Institutes of Health, Bethesda, 20850, Maryland, USA;
(3) Monjoy Saha, Division of Cancer Epidemiology and Genetics, National Cancer Institute, National Institutes of Health, Bethesda, 20850, Maryland, USA;
(4) Jonas S. Almeida, Division of Cancer Epidemiology and Genetics, National Cancer Institute, National Institutes of Health, Bethesda, 20850, Maryland, USA;
(5) Arlindo L. Oliveira, Instituto Superior Técnico, Universidade de Lisboa, Av. Rovisco Pais, Lisbon, 1049-001, Portugal and INESC-ID, R. Alves Redol 9, Lisbon, 1000-029, Portugal.
This paper is


