
Table of Links
Abstract and 1. Introduction
- The Compound Decision Paradigm
- Parametric Priors
- Nonparametric Prior Estimation
- Empirical Bayes Methods for Discrete Data
- Empirical Bayes Methods for Panel Data
- Conclusion
Appendix A. Tweedie’s Formula
Appendix B. Predictive Distribution Comparison
References
6. Empirical Bayes Methods for Panel Data
Longitudinal data poses many new challenges and opportunities for empirical Bayes methods. In this section we will reprise some prior work in Gu and Koenker (2017b) on models of income dynamics and describe some extensions that broaden applicability of such models. The vast econometric literature on panel data methods has gradually embraced a wider variety of latent variable formulations designed to accommodate more general forms of heterogeneity. The quantile autoregression framework of Arellano et al (2017) is notable in this regard. Empirical Bayes methods have a complementary role to play in this literature and also provide a flexible approach to modeling heterogeneity in panel data.
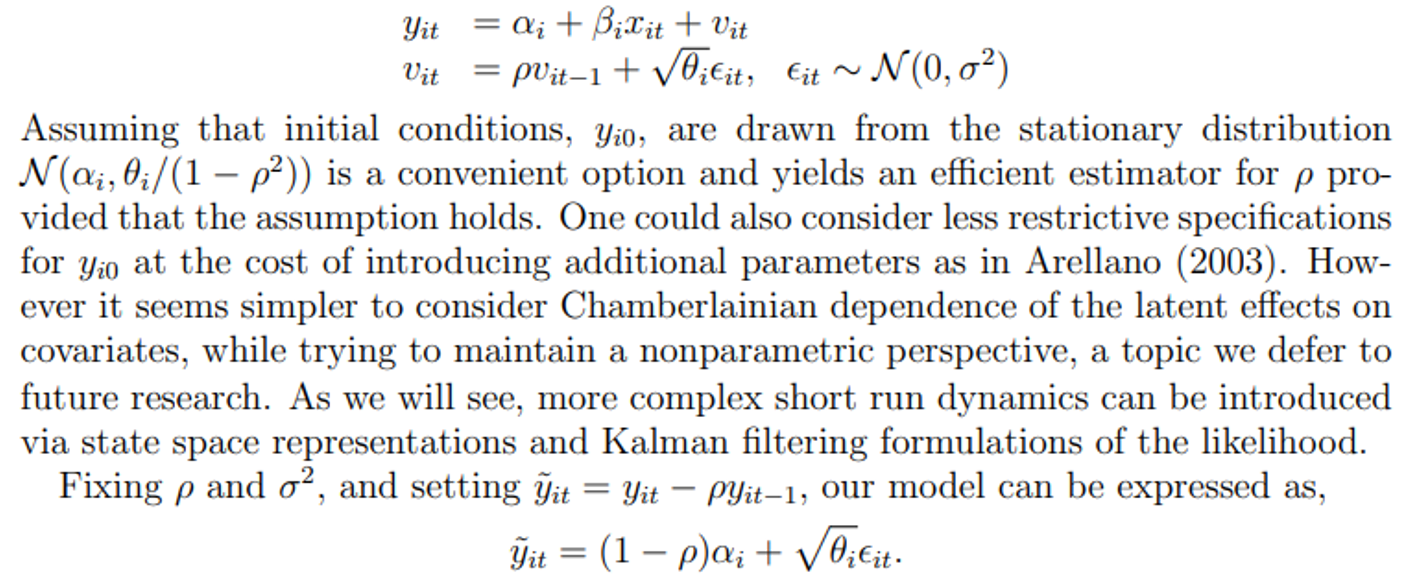
We will begin by considering a simple Gaussian location-scale model,
It is also possible to relax the independence assumption on the location and scale effects completely. In Gu and Koenker (2017b) we use longitudinal data individuals from the Panel Study on Income Dynamics (PSID) to explore models of income dynamics with an arbitrary joint distribution of location and scale heterogeneity. We follow the sample selection of Meghir and Pistaferri (2004) to focus on male head of households aged 25 – 55 with at least 9 years of consecutive earnings data. We further restrict our attention to those whose earning starts from age 25 onwards. This leaves us with 938 individuals for whom we observe at least the early portion of their life cycle earnings. Among the 938 individuals, 50% of those we observe have reported earnings of 15 years starting from age 25, The longest span of recorded earnings in the sample is 26 years.
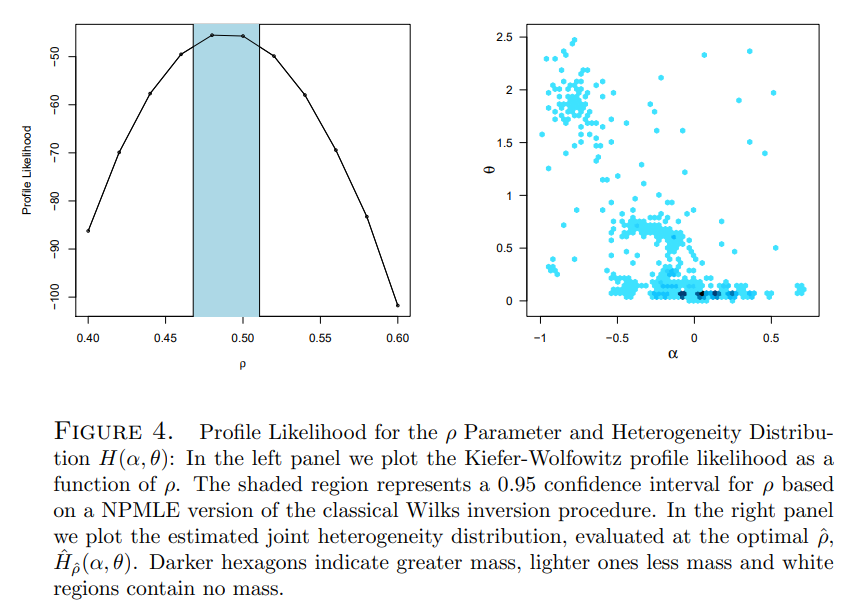
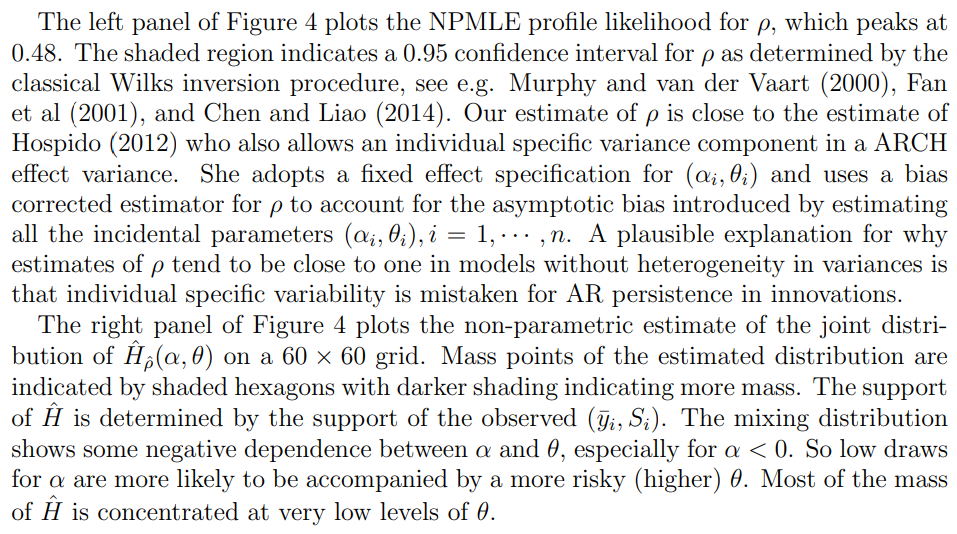
The implementation employs the function WGLVmix from the REBayes package. In the income dynamics application we find an apparent negative dependence between the α (location) and θ scale effects indicating that low “ability” individuals also tend to have higher income risk. In our prior work temporal dependence in the income process was specified as a simple AR(1) process whose coefficient, ρ was estimated by profile likelihood.
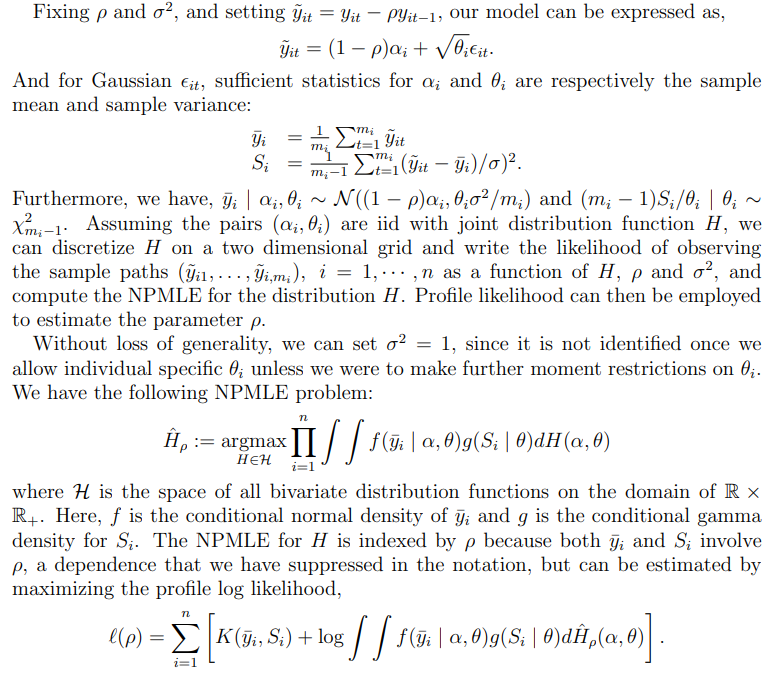
To make the AR(1) specification more explicit consider the model,
Allowing heterogeneous individual variances in earnings innovations is not new. Geweke and Keane (2000) contend that variance heterogeneity is crucial to account for non-Gaussian features of the innovation distribution. They use a parametric three-component mixture formulation. Hirano (2002) adopts a more flexible Dirichlet prior specification for similar reasons. Browning et al (2010) also find significant evidence that the variance of innovations varies across individuals. Their model posits eight latent factors all of which are constrained to obey parametric marginals. They comment “Nowhere in the literature is there any indication of how to specify a general joint distribution for these parameters, nor is there any hope of identifying the joint distribution non-parametrically.” In contrast, our approach allows only two latent factors, but has the advantage that it does permit non-parametric estimation of their joint distribution.
6.1. Prediction of Income Trajectories. We would like to adapt the univariate empirical Bayes rules for prediction described earlier to compound decision problems for longitudinal data models. This objective is closely aligned with the objectives of Chamberlain and Hirano (1999), although our computational methods may appear quite different. Given an initial trajectory for an individual’s earnings we would like to predict the remainder of the trajectory based not only on the prior history for the given individual, but also on the observed experience of a large sample of similar individuals. Chamberlain and Hirano motivate this prediction exercise as one facing a typical financial advisor. Similar problems present themselves in many biomedical settings where diagnosis is based on reference growth charts or some other measures of the progression of disease.
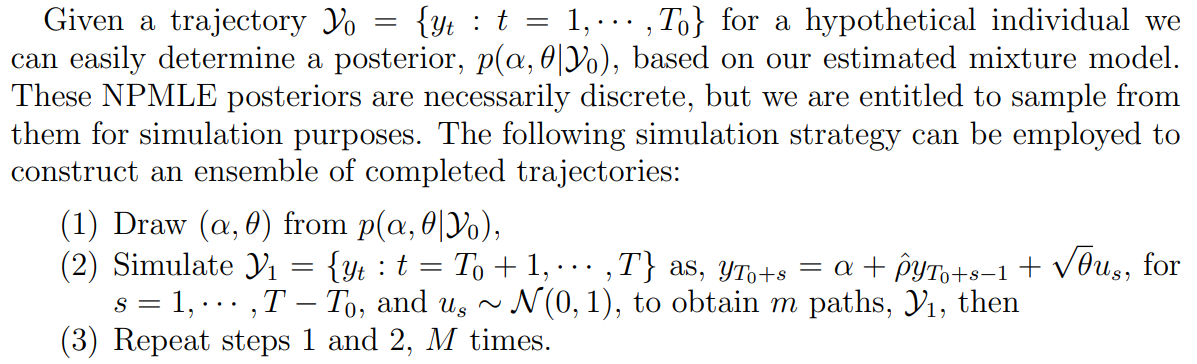
This procedure yields mM trajectories from which it is easy to construct pointwise and/or uniform prediction bands.
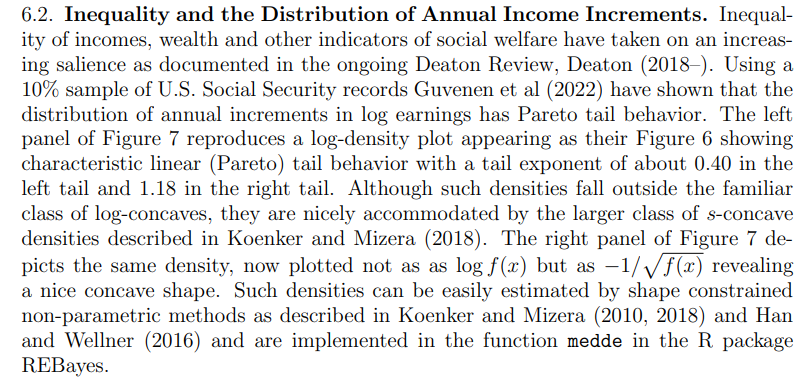
Given our estimates of the bivariate mixture model, it is of interest to see whether the estimated model can generate a similar marginal density for annual increments
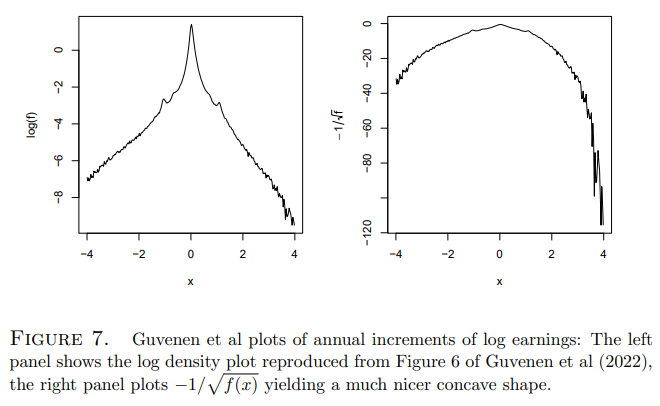
in log earnings. To investigate this we generate 2500, m = 50, M = 50, sample paths for each of the 938 PSID sampled individuals using their individual specific posterior distributions Hi, and the profile likelihood point estimate of ρ. These sample paths in log levels are then transformed to annual increments and a marginal density for these increments is then estimated. The resulting log and Hellinger transformed densities are shown in Figure 8. Not only are the shapes of the transformed densities remarkably similar to those in the Guvenen figure, the support of the estimated density is also remarkably consistent. It may seem surprising that our relatively small sample of 938 individuals from the PSID can create enough dispersion to generate this extreme tail behavior, however further reflection suggests that the estimated scale heterogeneity of the model is capable of generating some rather wild trajectories.
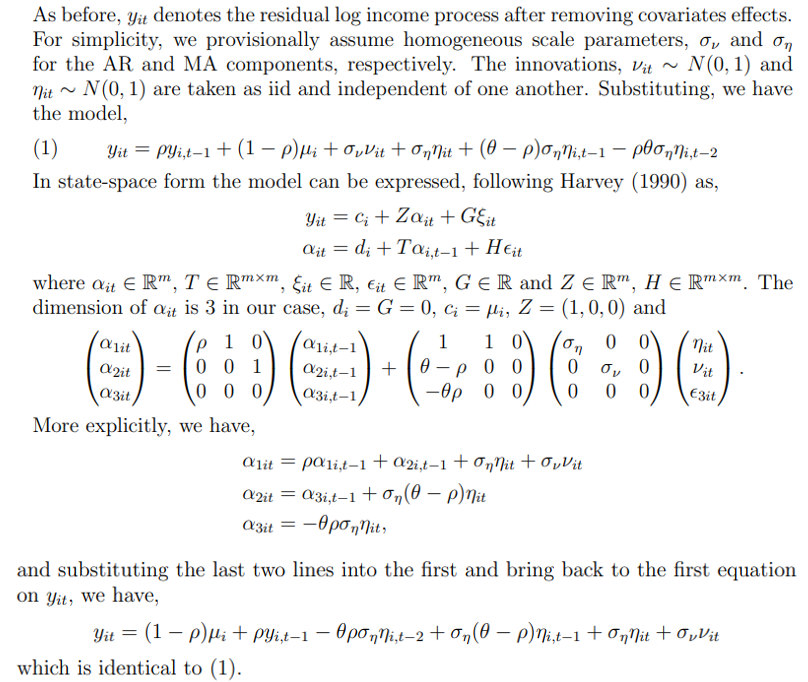
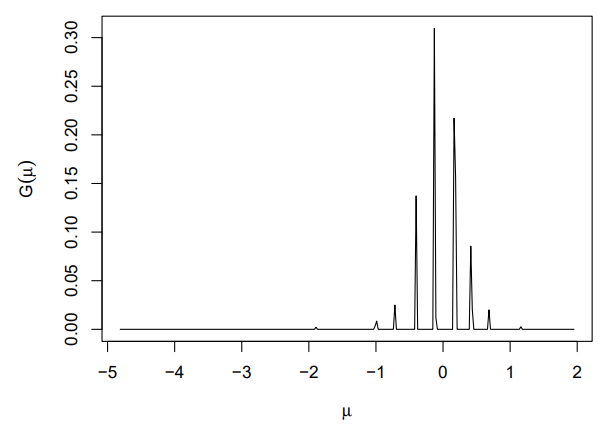
6.3. Heterogeneous ARMA Income Dynamics. The simple AR(1) dynamics of the preceding models is especially convenient since partial differencing yields sufficient statistics that make the likelihood easily computed. However, there is a long tradition going back to Friedman (1957) of considering more complex dynamics that decompose the income process into transitory and permanent components. To illustrate how such models can be accommodated within the empirical Bayes framework, we will consider the simple ARMA(1,1) specification adopted by Blundell (2014):

We should stress, however, that we still find the heterogeneous scale specification attractive because it enables one to make more reliable assessments of confidence bands for posterior mean predictions. In Appendix B we compare predictive fanplots for several representative individuals in our PSID sample. In the panels on the left side we have the predictions from the ARMA(1,1) model without any scale heterogeneity while in the right panels we have the predictions from the AR(1) model with both location and scale heterogeneity. Not unexpectedly, the ARMA(1,1) model prediction bands have the same width for all subjects, thereby over-covering for individuals with low variability in the initial period, and under-covering for those with high variability in the initial period. A secondary consequence of the scale homogeneity of the ARMA(1,1) model is that it fails to capture the extreme tail behavior illustrated in Figure 8 for the AR(1) model.
:::info
Authors:
(1) Roger Koenker;
(2) Jiaying Gu.
:::
:::info
This paper is available on arxiv under CC BY 4.0 DEED license.
:::


