Table of Links
Abstract and I. Introduction
II. Threat Model & Background
III. Webcam Peeking through Glasses
IV. Reflection Recognizability & Factors
V. Cyberspace Textual Target Susceptibility
VI. Website Recognition
VII. Discussion
VIII. Related Work
IX. Conclusion, Acknowledgment, and References
APPENDIX A: Equipment Information
APPENDIX B: Viewing Angle Model
APPENDIX C: Video Conferencing Platform Behaviors
APPENDIX D: Distortion Analysis
APPENDIX E: Web Textual Targets
III. WEBCAM PEEKING THROUGH GLASSES
In this section, we start with a feasibility test that reveals the 3 key building blocks of the webcam peeking threat model, namely (1) reflection pixel size, (2) viewing angle, and (3) light signal-to-noise ratio (SNR). For the first two building blocks, we develop a mathematical model that quantifies the related impact factors. For light SNR, we analyze one major factor it encompasses, i.e., image distortions caused by shot noise, and investigate using multi-frame super resolution (MFSR) to enhance reflection images. We will analyze other physical factors that affect light SNR in Section IV-D. Experiments are conducted with the Acer laptop with its built-in 720p webcam, the pair of BLB glasses, and the pair of prescription glasses described in Appendix A.
A. Feasibility Test
We conduct a feasibility test of recognizing single alphabet letters with a similar setup as in Figure 1. A mannequin wears the BLB glasses with a glass-screen distance of 30 cm. Capital letters with different cap heights (80, 60, 40, 20, 10 mm) are displayed and captured by the webcam. Figure 2 (upper) shows the captured reflections. We find that the 5 different cap heights resulted in letters with heights of 40, 30, 20, 10, and 5 pixels in the captured images. As expected,


texts represented by fewer pixels are harder to recognize. The reflection pixel size acquired by adversaries is thus one key building block of the characteristics of webcam peeking attack that we need to model. In addition, Figure 2 (lower) shows the ideal reflections with these pixel sizes by resampling the template image. Comparing the two, we notice small-size texts are subjected to additional distortions besides the issue of small pixel resolution and noise caused by the face background, resulting in a bad signal-to-noise ratio (SNR) of the textual signals.
To quantify the differences using objective metrics, we embody the notion of reflection quality in the similarity between the reflected texts and the original templates. We compared multiple widely-used image structural and textural similarity indexes including structural similarity Index (SSIM) [56], complex-wavelet SSIM (CWSSIM) [53], feature similarity (FSIM) [59], deep image structure and texture similarity (DISTS) [32] as well as self-built indexes based on scaleinvariant feature transform (SIFT) features [49]. Overall, we found CWSSIM which spans the interval [0, 1] with larger numbers representing higher reflection quality produces the best match with human perception results. Figure 2 shows the CWSSIM scores under each image.
The differences show that the SNR of reflected light corresponding to the textual targets is another key building block we need to characterize. Finally, we notice that when we rotate the mannequin with an angle exceeding a certain threshold, the webcam images do not contain the displayed letters on the screen anymore. It suggests that the viewing angle is another critical building block of the webcam peeking threat model which acts as an on/off function for successful recognition of screen contents. In the following sections, we seek to characterize these three building blocks.
B. Reflection Pixel Size
n the attack, the embodiment of textual targets undergoes a 2-stage conversion process: digital (victim software) → physical (victim screen) → digital (adversary camera). In the first stage, texts specified usually in point size in software by the user or web designers are rendered on the victim screen with corresponding physical cap heights. In the second stage, the on-screen texts get reflected by the glass, captured by the


camera, digitized, and transferred to the adversary’s software as an image with certain pixel sizes. Generally, more usable pixels representing the texts enable adversaries to recognize texts more easily. The key is thus to understand the mechanism of point size → cap height → pixel size conversion.
Point Size → Cap Height. Mapping between digital point size and physical cap height is not unique but dependent on user-specific factors and software. The conversion formula for most web browsers can be summarized as follows:


Cap Height → Pixel Size. We would like to remind the readers that we only use pixel size to represent the size of texts living in the images acquired by the adversary[2]. Figure 3 shows the model for this conversion process. To simplify the model, we assume the glasses lens, screen contents, and webcam are aligned on the same line with the same angle. The result of this approximation is the loss of projective transformation information, which only causes small inaccuracies for reflection pixel size estimation in most webcam peeking scenarios. Figure 3 only depicts one dimension out of the horizontal and vertical dimensions of the optical system but can be used for both dimensions. In this work we focus on the vertical dimension for analysis, i.e., the reflection pixel size we discuss is the height of the captured reflections in pixels. We summarize the parameters of this optical imaging system model in Table I. Through trigonometry, we know


C. Viewing Angle


D. Image Distortion Characterization
Generally, the possible distortions are composed of imaging systems’ inherent distortions and other external distortions. Inherent distortions mainly include out-of-focus blur and various imaging noises introduced by non-ideal camera circuits. Such inherent distortions exist in camera outputs even when no user interacts with the camera. External distortions, on the other hand, mainly include factors like motion blur caused by the movement of active webcam users.


For tremor-based motion, existing research suggests the mean displacement amplitude of dystonia patients’ head tremors is under 4 mm with a maximum frequency of about 6 Hz [34]. Since dystonia patients have stronger tremors than healthy people, this provides an estimation of the tremor amplitude upper bound. With the example glass in Section III-B and a 30 fps camera, the estimated pixel blur is under 1 pixel. Such a motion blur is likely to affect the recognition of extremely small reflections. Intentional motion is not a focus of this work due to its random, occasional, and individualspecific characteristics. We will experimentally involve the impacts of intentional user motions in the user study by letting users behave normally.
Distortion Analysis. To observe and analyze the dominant types of distortions, we recorded videos with the laptop webcam and a Nikon Z7 DSLR [17] representing a higherquality imaging system. The setup is the same as the feasibility test except that we tested with both the still mannequin and a human to analyze the effects of human tremor. Figure 14 (a) shows the comparison between the ideal reflection capture and the actual captures in three consecutive video frames of the webcam (1st row) and Nikon Z7 (2nd row) when the human wears the glasses. Empirically, we observed the following three key features of the video frames in this setup with both the mannequin and human (see Appendix D for details):
∙ Out-of-focus blur and tremor-caused motion blur are generally negligible when the reflected texts are recognizable.
∙ Inter-frame variance: The distortions at the same position of each frame are different, generating different noise patterns for each frame.
∙ Intra-frame variance: Even in a single frame, the distortion patterns are spatially non-uniform.
One key observation is that the captured texts are subjected to occlusions (the missing or faded parts) caused by shot noise [19] when there is an insufficient number of photons hitting the sensors. This can be easily reasoned in light of the short exposure time and small text pixel size causing reduced photons emitted and received. In addition, other common imaging noise such as Gaussian noise gets visually amplified by relatively higher ISO values due to the bad light sensitivity of the webcam sensors. We call such noise ISO noise. Both two types of distortions have the potential to cause intra-frame and inter-frame variance. The shot and ISO noise in the webcam peeking attack plays on a see-saw with an equilibrium point posed by the quality of the camera imaging sensors. It suggests that the threat level will further increase (see the comparison between the webcam and Nikon Z7’s images in Figure 14) as future webcams get equipped with better-quality sensors at lower costs.
E. Image Enhancing with MFSR.
The analysis of distortions calls for an image reconstruction scheme that can reduce multiple types of distortions and tolerate inter-frame and intra-frame variance. One possible method is to reconstruct a better-quality image from multiple low-quality frames. Such reconstruction problem is usually defined as multi-frame super resolution (MFSR) [58]. The basic idea is to combine non-redundant information in multiple frames to generate a better-quality frame.
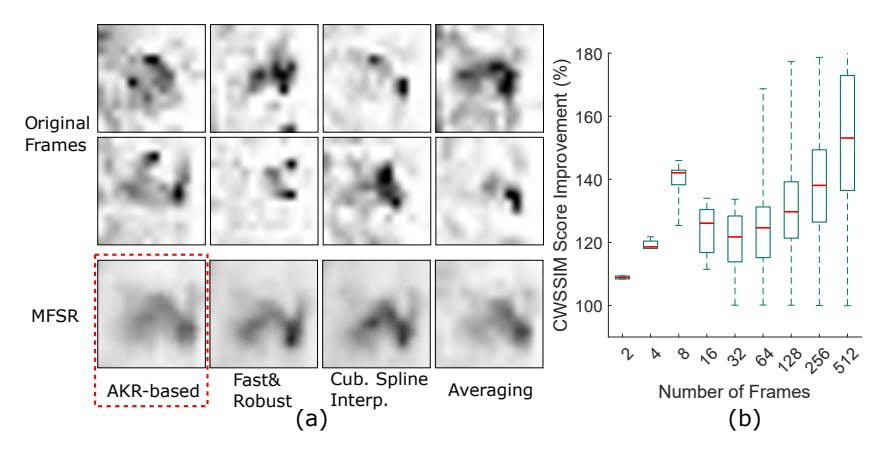
We tested 3 common light-weight MFSR approaches that do not require a training phase, including cubic spline interpolation [58], fast and robust MFSR [36], and adaptive kernel regression (AKR) based MFSR [41]. Test results on the reflection images show that the AKR-based approach generally yields better results than the other two approaches in our specific application and setup. All three approaches outperform a simple averaging plus upsampling of the frames after frame registration, which may be viewed as a degraded form of MFSR. An example of the comparison between the different methods and the original 8 frames used for MFSR is shown in Figure 4 (a). We thus use the AKR-based approach for the following discussions.
One parameter to decide for the use of webcam peeking is the number of frames used to reconstruct the high-quality image. Figure 4 (b) shows the CWSSIM score improvement of the reconstructed image over the original frames with different numbers of frames used for MFSR when a human wears the glasses to generate the reflections. Note that increasing the number of frames do not monotonically increase the image quality since live users’ occasional intentional movements can degrade image registration effectiveness in the MFSR process


and thus undermine the reconstruction quality. Based on the results, we empirically choose to use 8 frames for the following evaluations. In addition, the improvement in CWSSIM scores also validates that MFSR-resulted images have better quality than most of the original frames. We thus only consider evaluation using the MFSR images in the following sections.
Authors:
(1) Yan Long, Electrical Engineering and Computer Science, University of Michigan, Ann Arbor, USA ([email protected]);
(2) Chen Yan, College of Electrical Engineering, Zhejiang University, Hangzhou, China ([email protected]);
(3) Shilin Xiao, College of Electrical Engineering, Zhejiang University, Hangzhou, China ([email protected]);
(4) Shivan Prasad, Electrical Engineering and Computer Science, University of Michigan, Ann Arbor, USA ([email protected]);
(5) Wenyuan Xu, College of Electrical Engineering, Zhejiang University, Hangzhou, China ([email protected]);
(6) Kevin Fu, Electrical Engineering and Computer Science, University of Michigan, Ann Arbor, USA ([email protected]).
This paper is


[3] We mainly consider motions that are parallel to the screen because generally, they cause larger blurs than other types of motions


