By using this site, you agree to the Privacy Policy and Terms of Use.
Accept
World of SoftwareWorld of SoftwareWorld of Software
  • News
  • Software
  • Mobile
  • Computing
  • Gaming
  • Videos
  • More
    • Gadget
    • Web Stories
    • Trending
    • Press Release
Search
  • Privacy
  • Terms
  • Advertise
  • Contact
Copyright © All Rights Reserved. World of Software.
Reading: The Geek’s Guide to ML Experimentation | HackerNoon
Share
Sign In
Notification Show More
Font ResizerAa
World of SoftwareWorld of Software
Font ResizerAa
  • Software
  • Mobile
  • Computing
  • Gadget
  • Gaming
  • Videos
Search
  • News
  • Software
  • Mobile
  • Computing
  • Gaming
  • Videos
  • More
    • Gadget
    • Web Stories
    • Trending
    • Press Release
Have an existing account? Sign In
Follow US
  • Privacy
  • Terms
  • Advertise
  • Contact
Copyright © All Rights Reserved. World of Software.
World of Software > Computing > The Geek’s Guide to ML Experimentation | HackerNoon
Computing

The Geek’s Guide to ML Experimentation | HackerNoon

News Room
Last updated: 2025/09/21 at 6:04 PM
News Room Published 21 September 2025
Share
SHARE

Table of Links

Abstract and 1. Introduction

1.1 Post Hoc Explanation

1.2 The Disagreement Problem

1.3 Encouraging Explanation Consensus

  1. Related Work

  2. Pear: Post HOC Explainer Agreement Regularizer

  3. The Efficacy of Consensus Training

    4.1 Agreement Metrics

    4.2 Improving Consensus Metrics

    [4.3 Consistency At What Cost?]()

    4.4 Are the Explanations Still Valuable?

    4.5 Consensus and Linearity

    4.6 Two Loss Terms

  4. Discussion

    5.1 Future Work

    5.2 Conclusion, Acknowledgements, and References

Appendix

A APPENDIX

A.1 Datasets

In our experiments we use tabular datasets originally from OpenML and compiled into a set of benchmark datasets from the Inria-Soda team on HuggingFace [11]. We provide some details about each dataset:

Bank Marketing This is a binary classification dataset with six input features and is approximately class balanced. We train on 7,933 training samples and test on the remaining 2,645 samples.

California Housing This is a binary classification dataset with seven input features and is approximately class balanced. We train on 15,475 training samples and test on the remaining 5,159 samples.

Electricity This is a binary classification dataset with seven input features and is approximately class balanced. We train on 28,855 training samples and test on the remaining 9,619 samples.

A.2 Hyperparameters

Many of our hyperparameters are constant across all of our experiments. For example, all MLPs are trained with a batch size of 64, and initial learning rate of 0.0005. Also, all the MLPs we study are 3 hidden layers of 100 neurons each. We always use the AdamW optimizer [19]. The number of epochs varies from case to case. For all three datasets, we train for 30 epochs when 𝜆 ∈ {0.0, 0.25} and 50 epochs otherwise. When training linear models, we use 10 epochs and an initial learning rate of 0.1.

A.3 Disagreement Metrics

We define each of the six agreement metrics used in our work here.

The first four metrics depend on the top-𝑘 most important features in each explanation. Let 𝑡𝑜𝑝_𝑓 𝑒𝑎𝑡𝑢𝑟𝑒𝑠(𝐸, 𝑘) represent the top-𝑘 most important features in an explanation 𝐸, let 𝑟𝑎𝑛𝑘 (𝐸, 𝑠) be the importance rank of the feature 𝑠 within explanation 𝐸, and let 𝑠𝑖𝑔𝑛(𝐸, 𝑠) be the sign (positive, negative, or zero) of the importance score of feature 𝑠 in explanation 𝐸.

The next two agreement metrics depend on all features within each explanation, not just the top-𝑘. Let 𝑅 be a function that computes the ranking of features within an explanation by importance.

(Note: Krishna et al. [15] specify in their paper that 𝐹 is to be a set of features specified by an end user, but in our experiments we use all features with this metric).

A.4 Junk Feature Experiment Results

When we add random features for the experiment in Section 4.4, we double the number of features. We do this to check whether our consensus loss damages explanation quality by placing irrelevant features in the top-𝐾 more often than models trained naturally. In Table 1, we report the percentage of the time that each explainer included one of the random features in the top-5 most important features. We observe that across the board, we do not see a systematic increase of these percentages between 𝜆 = 0.0 (a baseline MLP without our consensus loss) and 𝜆 = 0.5 (an MLP trained with our consensus loss)

Table 1: Frequency of junk features getting top-5 ranks, measured in percent.

A.5 More Disagreement Matrices

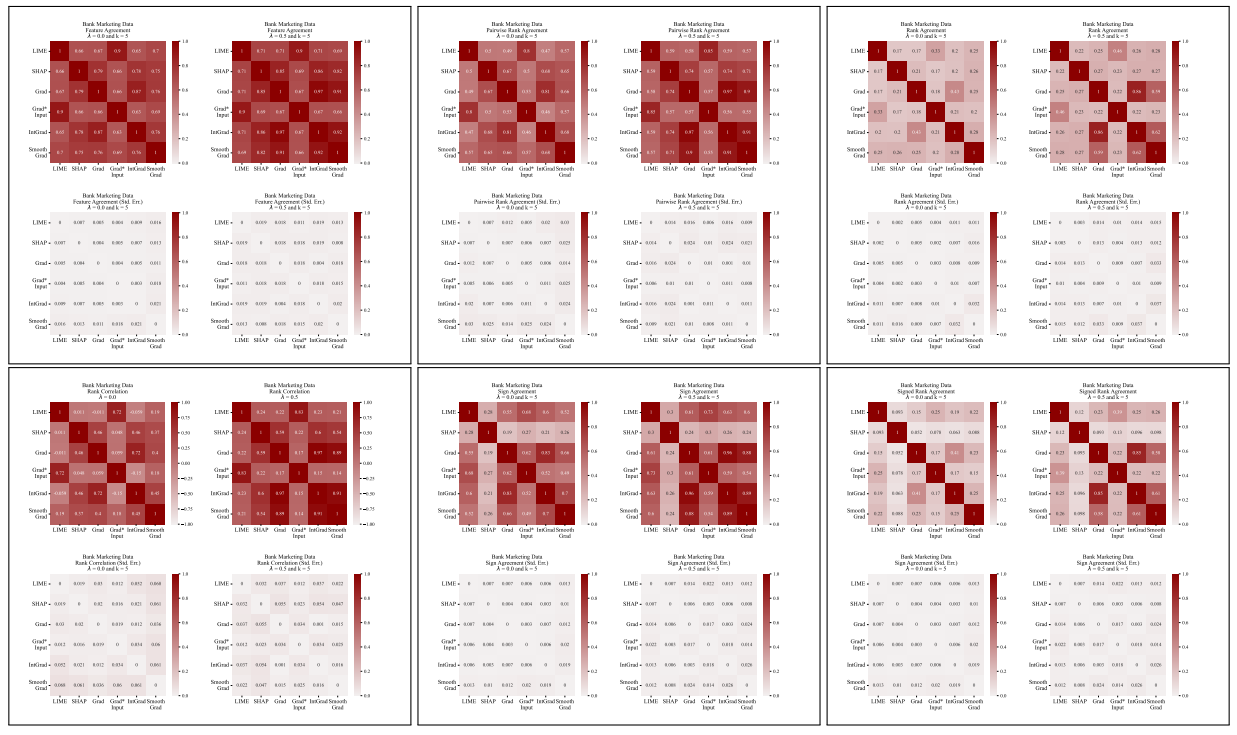
Figure 9: Disagreement matrices for all metrics considered in this paper on Bank Marketing data.

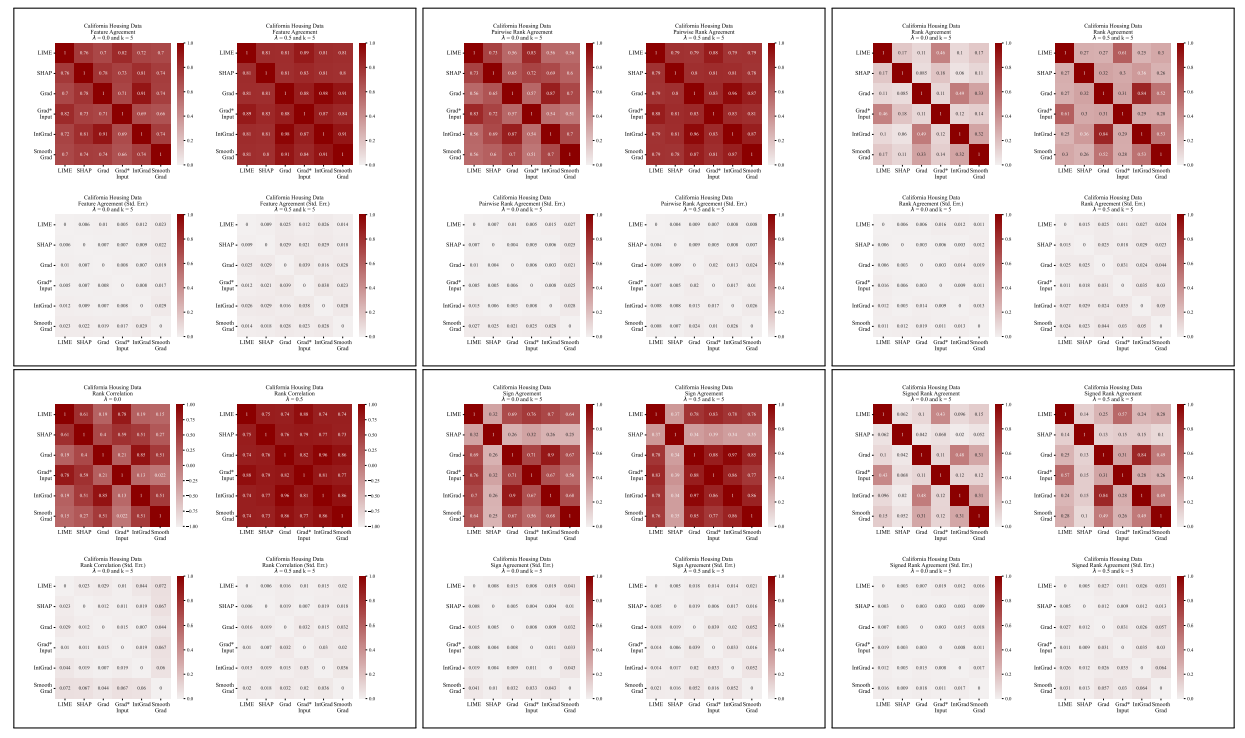
Figure 10: Disagreement matrices for all metrics considered in this paper on California Housing data.

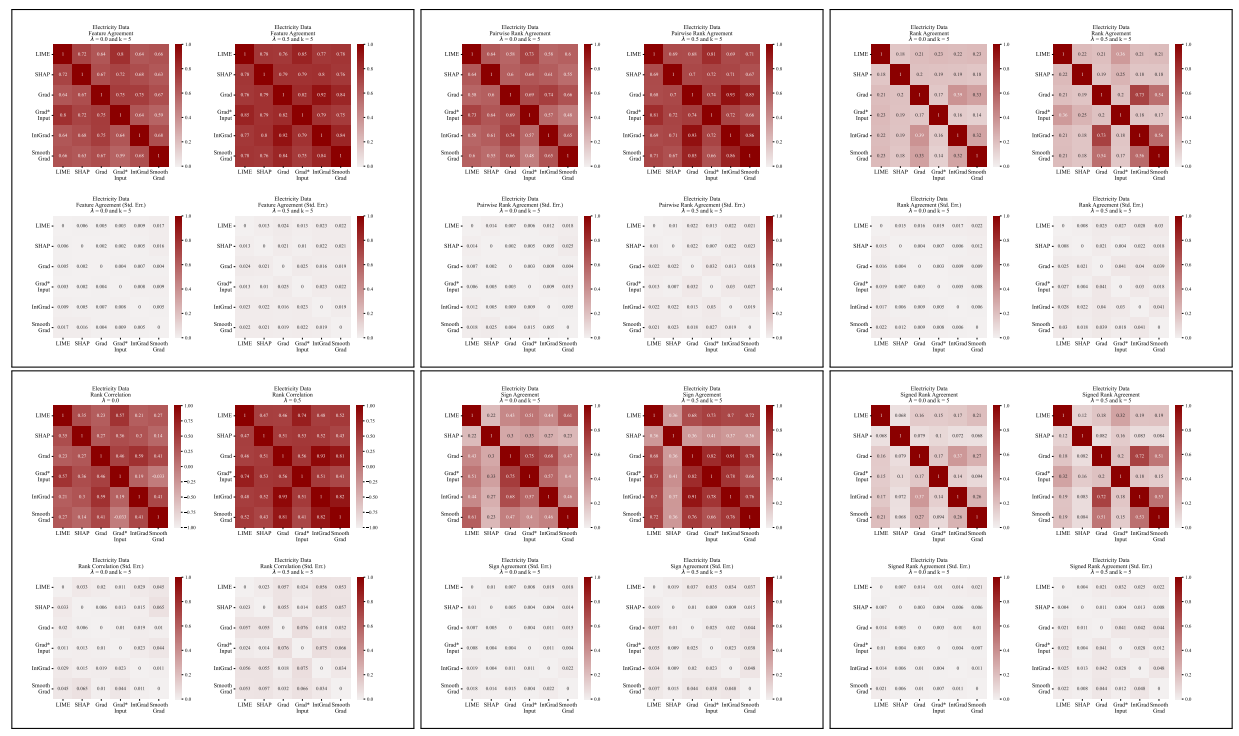
Figure 11: Disagreement matrices for all metrics considered in this paper on Electricity data.

A.6 Extended Results

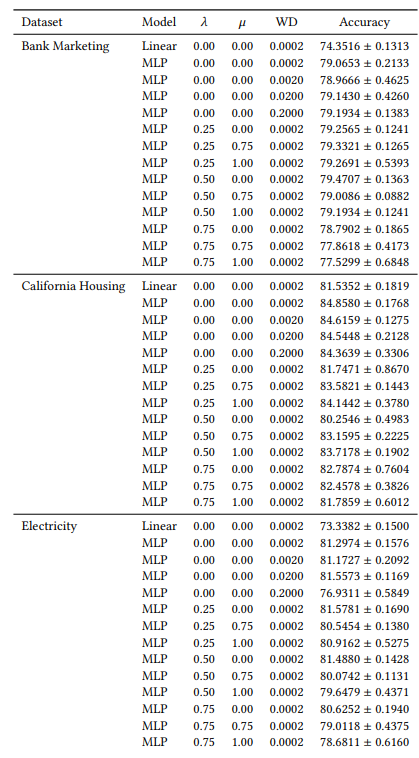
Table 2: Average test accuracy for models we trained. This table is organized by dataset, model, the hyperparameters in the loss, and the weight decay coefficient (WD). Averages are over several trials and we report the means ± one standard error.

A.7 Additional Plots

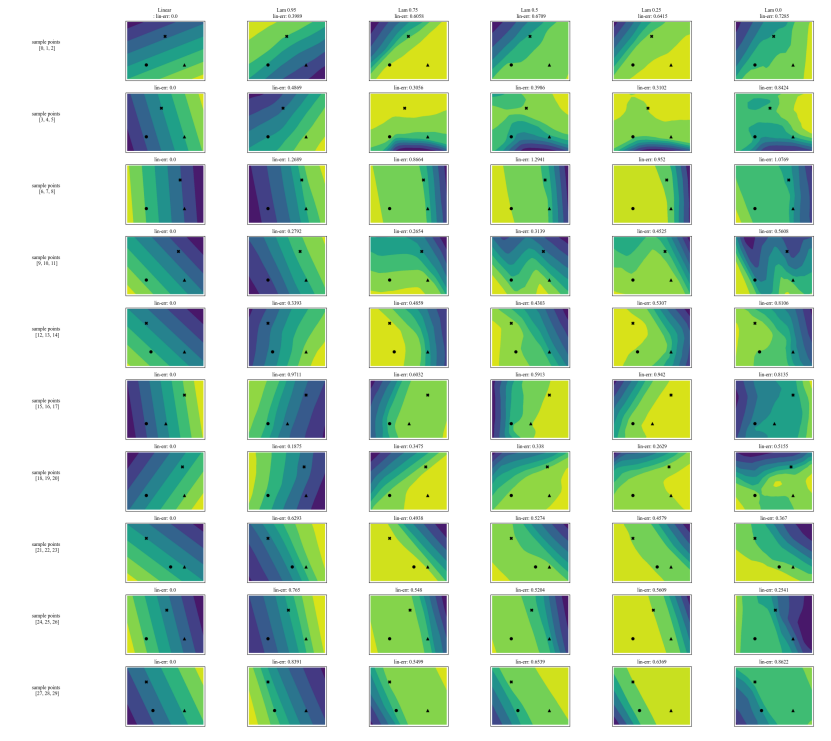
Figure 12: The logit surfaces for MLPs, each trained with a different lambda value, on 10 randomly constructed three-point planes from the Bank Marketing dataset.

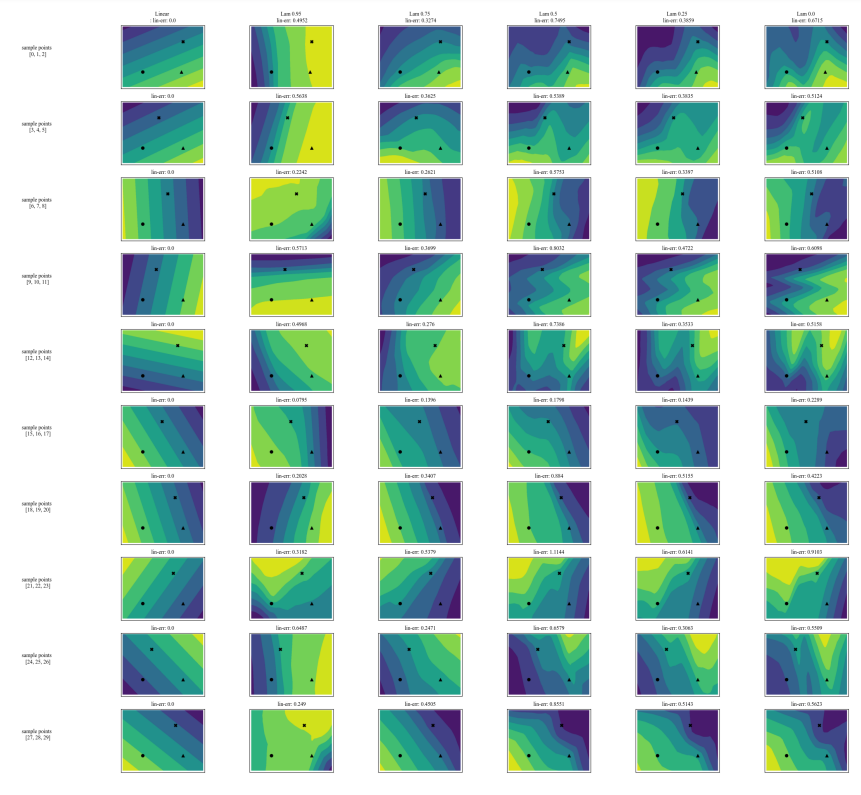
Figure 13: The logit surfaces for MLPs, each trained with a different lambda value, on 10 randomly constructed three-point planes from the California Housing dataset.

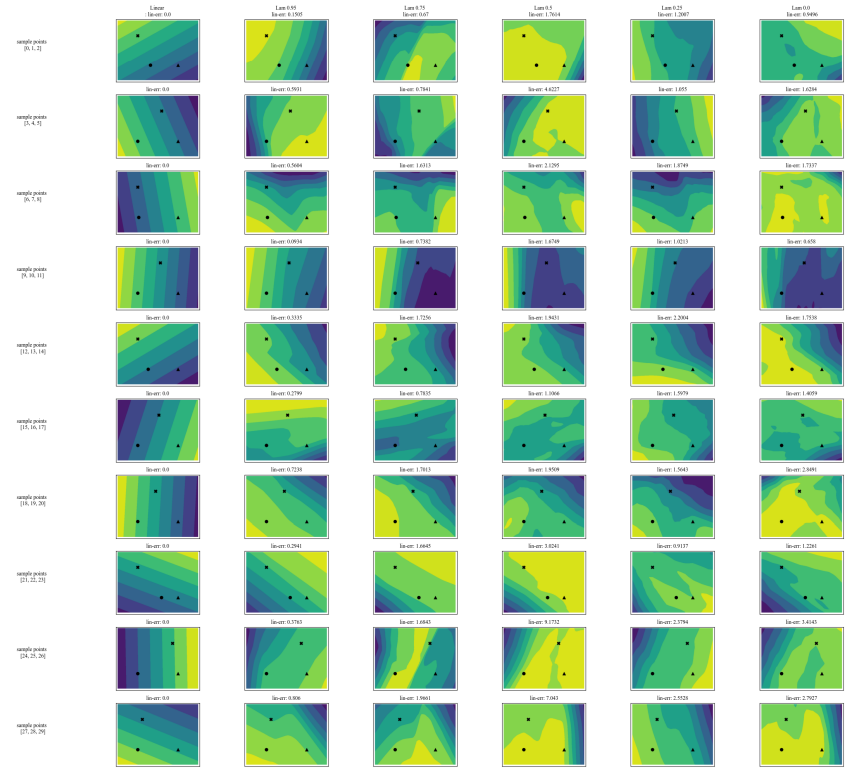
Figure 14: The logit surfaces for MLPs, each trained with a different lambda value, on 10 randomly constructed three-point planes from the Electricity dataset.

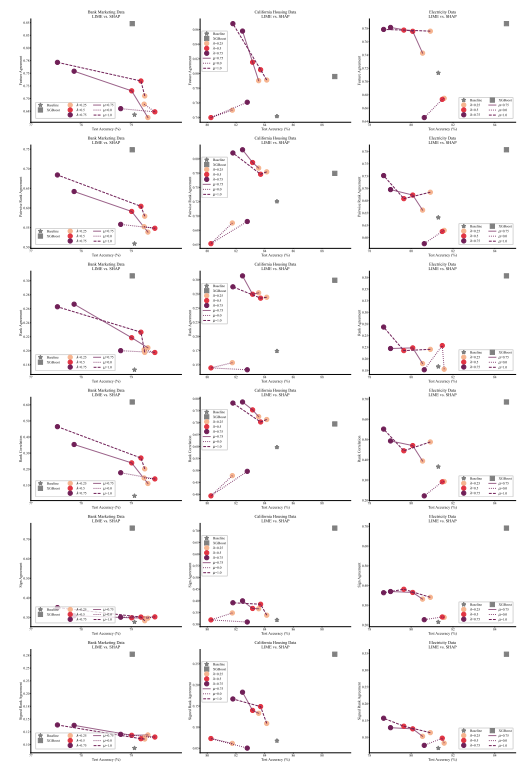
Figure 15: Additional trade-off curve plots for all datasets and metrics.

:::info
Authors:

(1) Avi Schwarzschild, University of Maryland, College Park, Maryland, USA and Work completed while working at Arthur (avi1umd.edu);

(2) Max Cembalest, Arthur, New York City, New York, USA;

(3) Karthik Rao, Arthur, New York City, New York, USA;

(4) Keegan Hines, Arthur, New York City, New York, USA;

(5) John Dickerson†, Arthur, New York City, New York, USA ([email protected]).

:::


:::info
This paper is available on arxiv under CC BY 4.0 DEED license.

:::

Sign Up For Daily Newsletter

Be keep up! Get the latest breaking news delivered straight to your inbox.
By signing up, you agree to our Terms of Use and acknowledge the data practices in our Privacy Policy. You may unsubscribe at any time.
Share This Article
Facebook Twitter Email Print
Share
What do you think?
Love0
Sad0
Happy0
Sleepy0
Angry0
Dead0
Wink0
Previous Article 5 practical tricks I use to extend my TV’s lifespan
Next Article Trump, Musk reunite at Kirk memorial
Leave a comment

Leave a Reply Cancel reply

Your email address will not be published. Required fields are marked *

Stay Connected

248.1k Like
69.1k Follow
134k Pin
54.3k Follow

Latest News

Slash $200 off Apple’s most powerful iPad at Amazon
News
JD buys out Walmart’s stake in Dada · TechNode
Computing
Astronaut Chris Hadfield shares lessons on leading under pressure ahead of Calgary summit
News
Every Netflix User Should Know About These Secret Codes – BGR
News

You Might also Like

Computing

JD buys out Walmart’s stake in Dada · TechNode

1 Min Read
Computing

9 Best Instagram Reels Editing Apps on the Market in 2025

1 Min Read
Computing

The Tortoise and the Hare: An Unexpected Scheduling Race Between MILP and CP Solvers | HackerNoon

17 Min Read

Army pushes battlefield AI as counter-drone fight takes center stage

6 Min Read
//

World of Software is your one-stop website for the latest tech news and updates, follow us now to get the news that matters to you.

Quick Link

  • Privacy Policy
  • Terms of use
  • Advertise
  • Contact

Topics

  • Computing
  • Software
  • Press Release
  • Trending

Sign Up for Our Newsletter

Subscribe to our newsletter to get our newest articles instantly!

World of SoftwareWorld of Software
Follow US
Copyright © All Rights Reserved. World of Software.
Welcome Back!

Sign in to your account

Lost your password?