Table of Links
- Abstract and Introduction
- Backgrounds
- Type of remote sensing sensor data
- Benchmark remote sensing datasets for evaluating learning models
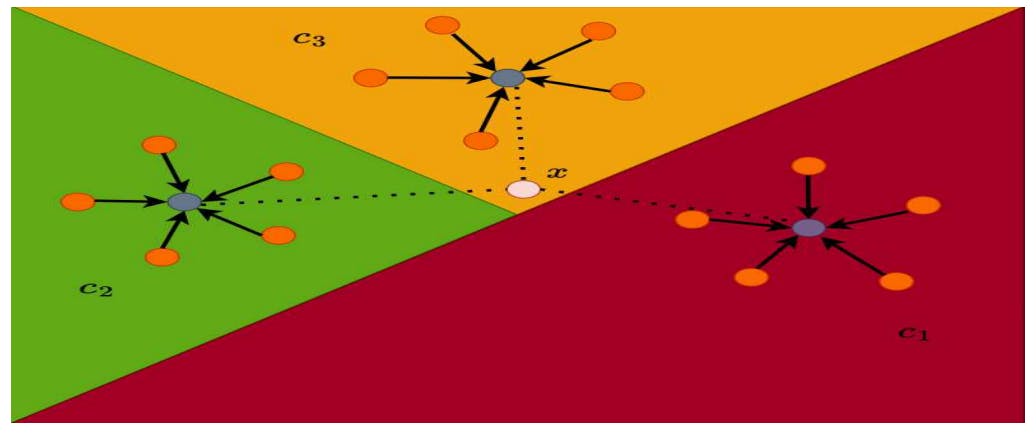
- Evaluation metrics for few-shot remote sensing
- Recent few-shot learning techniques in remote sensing
- Few-shot based object detection and segmentation in remote sensing
- Discussions
- Numerical experimentation of few-shot classification on UAV-based dataset
- Explainable AI (XAI) in Remote Sensing
- Conclusions and Future Directions
- Acknowledgements, Declarations, and References
4 Benchmark remote sensing datasets for evaluating learning models
In this section, we will provide a brief overview of commonly used benchmark datasets that evaluate algorithms in remote sensing. The datasets are categorized and listed based on the type of remote sensing data and platforms they were collected from. It is important to note that these datasets are frequently used by researchers to evaluate and benchmark their algorithms, and although not included in the survey works by [8], they are essential for this review.
4.1 Hyperspectral image dataset
4.1.1 Satellite-Based Data
Most of the datasets described here are more tailored for multi-label image classification, although a few single label-based classification dataset exist.
• Pavia [20, 21]: The Pavia University research team created a hyperspectral image dataset with images consisting of 610 × 610 pixels and 103 spectral bands. Each image in the dataset is a classification map with 9 classes that include mostly urban contexts such as bitumen, brick, and asphalt. The dataset comprises 42,776 labeled images and is specifically designed for multi-label classification.
• Indian Pines [20, 22]: The dataset contains hyperspectral images of a particular landscape in Indiana. It is a multi-label classification dataset where each map consists of 145 × 145 pixels and 224 spectral bands. There are 16 semantic labels available for each map, and the dataset has a total of 10,249 samples.
• Salinas Valley [20]: The Salinas Valley dataset consists of hyperspectral images collected from California, with multi-label classification maps of pixel size 512 × 217 and 224 spectral bands, similar to the Indian Pines dataset. There are 16 semantic classes with 54,129 samples. A subset of the Salinas dataset, referred to as Salinas-A, includes only 86 × 86 image pixels of 6 classes, with a total of 5,348 samples.
• Houston [18]: The Hyperspectral Image Analysis group in collaboration with the NSF Funded Center for Airborne Laser Mapping (NCALM) has acquired images across the University of Houston. This dataset comprises 16 semantic classes of urban objects such as highways, railways, and tennis courts, unlike the Botswana, Indian Pines, and Salinas Valley datasets. The images have 144 spectral bands in the 380 nm to 1050 nm region, and each image has a pixel size of 349 × 1905. The dataset is designed for evaluating multi-label image classification.
• BigEarthNet [23]: The dataset consists of pairs of Sentinel-2 images captured by a multi-spectral sensor, with 590326 pairs collected from 10 European countries. Each image in the pair has a size of 120 × 120 pixels and covers 13 spectral bands. The dataset is annotated with multiple land-cover classes or labels, making it suitable for multi-label classification evaluation.
• EuroSat [24]: The dataset consists of images obtained from the Sentinel2 satellite, covering 13 spectral bands with 10 classes and 27,000 labeled samples. It is utilized for evaluating single-label-based land cover and land use classification. Each image has a pixel size of 64 × 64.
• SEN12MS [25]: The dataset comprises 180,662 images captured from Sentinel-1 and Sentinel-2, with four cover types categorized using different classification schemes. Each image is of size 256 × 256 and contains different spectral bands. The images are annotated by multiple land-cover labels, but the primary objective is to use these labels to infer the overall context of the scene, such as forest, grasslands, or savanna, making it suitable for single label-based scene classification. It is important to note that Sentinel1 images are SAR images, making the dataset useful for SAR-based map classification as well.
4.1.2 UAV-based dataset
• WHU-Hi [26]: The WHU-Hi dataset, which stands for Wuhan UAV-borne Hyperspectral Image, consists of UAV-based images of various crop types gathered in farming areas in Hubei province, China. It is divided into three sub-datasets: WHU-Hi-LongKou, WHU-Hi-HanChuan, and WHU-HiHonghu, each with different individual image sizes, numbers of labels/- classes, and spectral bands, which are explained in Table 2. The dataset is suitable for evaluating multi-label classification algorithms.
4.2 VHR image-based dataset
4.2.1 Satellite-based datasets
• UC Merced Landuse [27]: The dataset was designed for single-label land use classification and comprises 2100 RGB images, each of size 256 × 256 pixels. The dataset consists of 21 classes, predominantly related to urban land use.
• ISPRS Potsdam [28]: The International Society of Photogrammetry and Remote Sensing (ISPRS) developed a dataset for algorithmic evaluation of multi-label map classification. The dataset comprises 38 patches/images. The pixel size of each patch is 6000 × 6000.
• ISPRS Vaihingen [28]: The dataset was created for multi-label map classification and includes 33 patches/images of varying sizes. The pixel size of each patch is 2494 × 2064.
• RESISC45 [29]: The Northwestern Polytechnical University (NWPU) created a dataset for single-label image scene classification. The dataset contains 31,500 images categorized into 45 classes, with each class consisting of 700 images. The pixel size of each image is 256 × 256.
• WHU-RS19 [30]: The dataset is created using satellite images obtained from Google Earth and contains 19 semantic classes, with approximately 50 samples per class. Samples from same class are extracted from different regions with varying resolutions, scales, orientations, and illuminations. Each image in the dataset is 600 x 600 pixels in size. It is intended for the purpose of single label-based image scene classification.
• AID [31]: The Aerial Image Database (AID) is a collection of 10,000 satellite images gathered from Google Earth, each sized 600 × 600 pixels. The dataset includes 30 classes primarily related to urban environments. As with the RESISC45 and WHU-RS19 datasets, AID is used for single-label image scene classification purposes.
4.2.2 UAV-based dataset
• AIDER [12]: The Aerial Image Database for Emergency Response (AIDER) is a collection of 8540 UAV images categorized into four disaster categories – collapsed buildings, fire, flood, and traffic accidents, along with a nondisaster category labeled as ”normal” [32]. This is one of the first UAV-based datasets that can be used as a benchmark for visual-based humanitarian aid or search-and-rescue operations in the RGB spectrum.
• SAMA-VTOL [33]: The SAMA-VTOL aerial image dataset is a new dataset developed from images captured by UAVs. This dataset was created to support a broad spectrum of scientific projects within the field of remote sensing. It is particularly useful for research projects focused on 3D object modeling, urban and rural mapping, and the processing of digital elevation and surface models. The objective is to provide high-resolution, low-cost data that contribute to a better understanding of both urban and rural scenes for various applications.
4.3 SAR image-based dataset
• MSTAR [34]: This dataset consists of 5950 X-band spectral images, each with a size of 128 × 128 pixels, and categorized into 10 classes. It is designed specifically for military object recognition and classification.
• OpenSARShip [35]: The dataset includes 11,346 chips of ships captured by C-band SENTINEL-1 SAR imagery, belonging to 17 ship types, and collected from 41 images. Each chip is labeled with automatic identification system messages indicating different environmental conditions. The image sizes of the chips range from 30 × 30 to 120 × 120 pixels.
It is evident that there are fewer SAR-based benchmark datasets compared to hyperspectral or VHR-based image datasets. According to Fu et al. [36], collecting SAR-based images with fine annotation is more challenging due to the difficulty of acquisition and the tedious and time-consuming process of interpreting and labeling such images. Furthermore, Rostami et al. [37] stated that the devices used for generating SAR images are costly, and the data accessibility is strictly regulated due to its classification.


In Table 2, we have summarized the discussion on the available datasets, highlighting the data type, number of images and classes, pixel sizes, spectral bands (if any), platform, and classification method.
Authors:
(1) Gao Yu Lee, School of Electrical and Electronic Engineering, Nanyang Technological University, 50 Nanyang Ave, 639798, Singapore ([email protected]);
(2) Tanmoy Dam, School of Mechanical and Aerospace Engineering, Nanyang Technological University, 65 Nanyang Drive, 637460, Singapore and Department of Computer Science, The University of New Orleans, New Orleans, 2000 Lakeshore Drive, LA 70148, USA ([email protected]);
(3) Md Meftahul Ferdaus, School of Electrical and Electronic Engineering, Nanyang Technological University, 50 Nanyang Ave, 639798, Singapore ([email protected]);
(4) Daniel Puiu Poenar, School of Electrical and Electronic Engineering, Nanyang Technological University, 50 Nanyang Ave, 639798, Singapore ([email protected]);
(5) Vu N. Duong, School of Mechanical and Aerospace Engineering, Nanyang Technological University, 65 Nanyang Drive, 637460, Singapore ([email protected]).


