Whether you are a beginner in cryptocurrency or you are looking to improve your trading skills, reading crypto charts should be one of the first things you master. Watching the prices go up and down is one thing, but interpreting what market data is trying to tell you is something different entirely. If you intend to be serious about trading cryptocurrency, chart analysis will definitely aid you in identifying trends, reversals, and breakout opportunities.
What is a Crypto Chart?
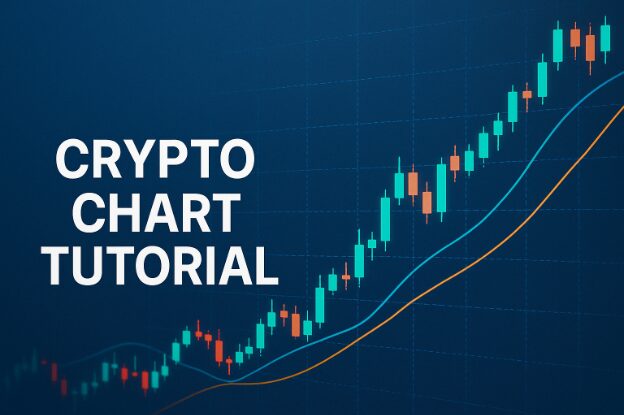
A crypto chart displays the price activities of a specific cryptocurrency over a given period. Most traders use candlestick charts due to the details offered in more advanced versions compared to graphically simpler versions, like line graphs. Each candle displays four major price levels, also known as “Open,” “Close,” “High” and “Low” respectively.
Candles are often green representing bullish movement or red indicating bearish movements.
Key Chart Types
Borne from years of trading practice, the bar chart displays similar features to candlestick charts and may even be more informative. Other traders may use line charts which are more simplistic and only display closing prices, or heikin-ashi which is a candlestick variation that removes volatility by smoothing. For those beginning their trading journey, candlesticks provide the most informative view.
Support and Resistance Levels
The concepts of support and resistance are key when analyzing a chart:
- Support is the price level at which buying starts and tends to cut off further decline.
- Resistance is the level where selling starts and cuts off the price increase.
In most cases, traders draw horizontal lines to mark these levels and wait for price to either bounce off from or break through these levels.
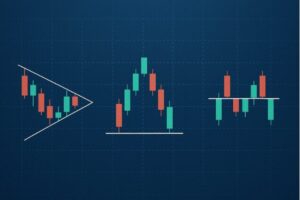
Popular Chart Patterns
- Head and Shoulders (bearish reversal)
- Cup and Handle (bullish continuation)
- Double Top/Bottom (reversal)
- Ascending/Descending Triangle (breakout indicators)
More often than not, patterns occur and reoccur at different points in various crypto charts. Many traders actively rely on these patterns to predict market movement.
Seeing these patterns early provides traders with a directional edge alongside a blueprint for configuring any price targets and stop loss levels.
What to Monitor
From the structure of the chart, technical indicators help in measuring the strength of a trend and its likely reversals:
- Moving Averages (MA): The 50-day and 200-day MAs assist in determining the direction of the trend as well as major support and resistance levels.
- Relative Strength Index (RSI): Indicates whether a given asset is in the overbought or oversold status (typically using a scale of 0-100).
- MACD (Moving Average Convergence Divergence): A momentum indicator that exhibits the change in trends through crossovers.
- Volume: Validates the strength of a price move – high volume during breakouts is more compelling.
Using indicators along with chart patterns helps provide better and stronger entry and exit signals.
All Timeframes are Important
Different timeframes give different views which can alter your entire outlook. Here are timeframes with their corresponding trading styles:
- 5-minute is preferred by scalpers and day traders.
- 4 hour and daily charts suit swing traders.
- Weekly charts provide longer term view for position traders.
Don’t forget to zoom out and take a look at the bigger picture before getting into a trade based on short term signals.
Charting and Risk Management Tools
Look at charts as the heart of your strategy and know how to protect your capital. Good chart readers will employ:
- Stop-loss levels determined using support and resistance.
- Position sizing determined by portfolio and risk taken in trade.
- Use TradingView, CoinMarketCap, or Binance charts for testing and visualizing trends.
As important as identifying setups is, risk management is equally critical.
Conclusion:
Crafted with graphical artistry, crypto charts are arguably among the most sophisticated tools on the market today as they synthesize technical patterns, trader emotions, and market volatility into one. Understanding chart patterns will not guarantee profits, but it does enable traders to make logistically sound decisions which is far better than relying on gut feeling.
In order to hone your technical skills and sharpen your reflexes for crypto trading, it is best to start with the fundamentals of charting.
Disclaimer: This article does not qualify as financial advice and is purely for educational purposes. Always remember to do sufficient research and trade responsibly.


