Table of Links
- Abstract and Introduction
- Backgrounds
- Type of remote sensing sensor data
- Benchmark remote sensing datasets for evaluating learning models
- Evaluation metrics for few-shot remote sensing
- Recent few-shot learning techniques in remote sensing
- Few-shot based object detection and segmentation in remote sensing
- Discussions
- Numerical experimentation of few-shot classification on UAV-based dataset
- Explainable AI (XAI) in Remote Sensing
- Conclusions and Future Directions
- Acknowledgements, Declarations, and References
3 Type of remote sensing sensor data
Remote sensing data is typically acquired from satellite or unmanned aerial vehicle (UAV) platforms, and the characteristics of the data can vary greatly depending on the specific platform and sensor used. They can be classified according to their spatial, spectral, radiometric, and temporal resolutions, as discussed in [8] and [9].
• Spatial resolution: The spatial resolution of remote sensing data is often limited by the size and altitude of the sensor platform, as well as the resolution of the sensor itself. For example, satellite-based sensors typically have a lower spatial resolution than UAV-based sensors, due to their higher altitude and larger coverage area.
• Spectral resolution: Spectral resolution refers to the range of wavelengths that a remote sensing sensor can detect, as well as the sampling rate at which it collects data across this range. Different sensors have different spectral characteristics, and the spectral resolution of a sensor can have a significant impact on its ability to distinguish different features or objects in the scene.
• Radiometric resolution: Radiometric resolution is related to the sensitivity of the sensor and the number of bits utilized for signal representation. A higher radiometric resolution means that the sensor is able to capture a wider range of signal strengths and more accurately represent the scene being imaged.
• Temporal resolution: Temporal resolution is a critical characteristic of remote sensing data, as it can enable the tracking of changes in a scene over time. The frequency with which images are collected, as well as the length of time over which they are collected, can impact the ability of remote sensing systems to detect and monitor changes in the scene, such as vegetation growth or land use changes.
Understanding the various characteristics of remote sensing data is important for developing effective machine learning approaches, as different methods may be better suited to different types of data. For example, models that perform well on high-resolution satellite imagery may not perform as well on lower-resolution UAV data, and vice versa. By considering the characteristics of the data and tailoring machine learning approaches to the specific problem at hand, researchers can develop more accurate and effective models for remote sensing applications.
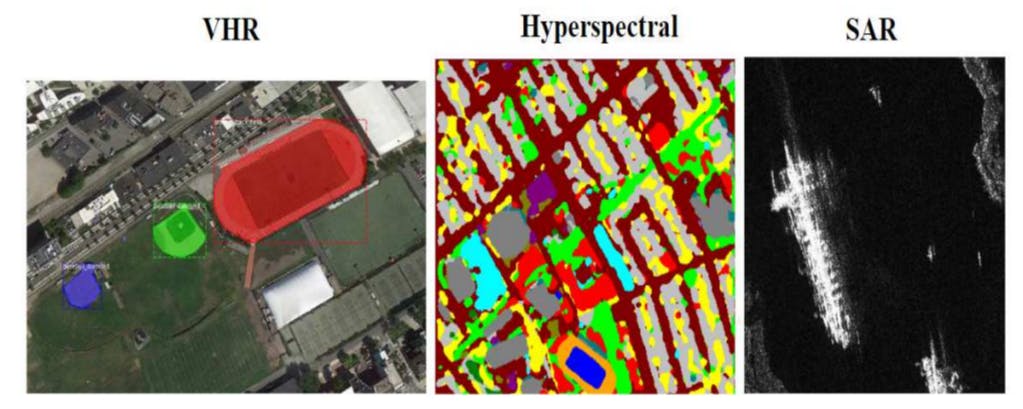
![Fig. 6 Illustration of each remote sensing image category. The VHR image is from the VHR-10 dataset [17], the hyperspectral image is from the Houston dataset [18], and the SAR image is from the HR-SID dataset [19].](data:image/gif;base64,R0lGODlhAQABAIAAAAAAAP///yH5BAEAAAAALAAAAAABAAEAAAIBRAA7)
![Fig. 6 Illustration of each remote sensing image category. The VHR image is from the VHR-10 dataset [17], the hyperspectral image is from the Houston dataset [18], and the SAR image is from the HR-SID dataset [19].](https://hackernoon.imgix.net/images/null-3m034ei.png?auto=format&fit=max&w=2048)
A classification of image data types can also be made based on three categories, namely Very High-Resolution Imagery, Hyperspectral Imagery, and Synthetic Aperture Radar Imagery, as discussed in [8] and [9]. Figure 4 provides some examples of such imagery.
• Very High Resolution (VHR) imagery: Very High Resolution (VHR) imagery is often captured through the use of VHR satellite sensors, which are designed to capture images with an extremely high level of detail. This level of detail can be particularly beneficial for a number of different applications, including object detection and tracking, as well as emergency response operations. As the technology behind optical sensors continues to advance, the spatial resolution obtained from these sensors becomes even finer, allowing for even greater levels of detail to be captured in these images. This, in turn, can lead to even more accurate object detection and tracking, as well as more effective emergency response operations that are better able to respond to events as they unfold in real time.
• Hyperspectral imagery: In addition to the optical electromagnetic spectrum that is often represented by the RGB color channels, remote sensing signals and imagery can also be obtained and analyzed in other parts of the spectrum, including the infrared (IR) and ultraviolet (UV) regions. In particular, the IR spectrum can be further categorized into near, mid or farinfrared, and the corresponding images captured in these ranges are known as hyperspectral imagery. This type of imagery goes beyond the three color channels of optical images and contains more spectral information, enabling the unraveling of the composition of the object of interest, both physically and chemically. As such, hyperspectral images are particularly useful for environmental and earth-science-based research, as they can provide detailed information on factors such as vegetation health, mineral composition, and water quality. By analyzing this spectral information, researchers can gain a deeper understanding of the earth’s surface, as well as monitor changes and anomalies that may indicate potential issues.
• Synthetic Aperture Radar (SAR) imagery: By utilizing the process of emission and reception of electromagnetic waves on the Earth, radar-based remote sensing can be accomplished. Such remote sensing techniques can acquire high spatial resolution images regardless of weather conditions, and are widely applicable in numerous domains. In particular, Synthetic Aperture Radar (SAR) based images have been utilized in diverse fields, including disaster management, hydrology and forestry, due to their ability to provide high-quality images regardless of atmospheric conditions, time of day or season. SAR-based imagery can thus be a valuable source of information for remote sensing-based research and applications.
Authors:
(1) Gao Yu Lee, School of Electrical and Electronic Engineering, Nanyang Technological University, 50 Nanyang Ave, 639798, Singapore ([email protected]);
(2) Tanmoy Dam, School of Mechanical and Aerospace Engineering, Nanyang Technological University, 65 Nanyang Drive, 637460, Singapore and Department of Computer Science, The University of New Orleans, New Orleans, 2000 Lakeshore Drive, LA 70148, USA ([email protected]);
(3) Md Meftahul Ferdaus, School of Electrical and Electronic Engineering, Nanyang Technological University, 50 Nanyang Ave, 639798, Singapore ([email protected]);
(4) Daniel Puiu Poenar, School of Electrical and Electronic Engineering, Nanyang Technological University, 50 Nanyang Ave, 639798, Singapore ([email protected]);
(5) Vu N. Duong, School of Mechanical and Aerospace Engineering, Nanyang Technological University, 65 Nanyang Drive, 637460, Singapore ([email protected]).


