Table of Links
Abstract/Zusammenfassung
Publications
Acknowledgements
CHAPTER 1: INTRODUCTION
-
Introduction
1.1 Overview of thesis contributions
1.2 Thesis outline
CHAPTER 2: BACKGROUND
2.1 Blockchains & smart contracts
2.2 Transaction prioritization norms
2.3 Transaction prioritization and contention transparency
2.4 Decentralized governance
2.5 Blockchain Scalability with Layer 2.0 Solutions
CHAPTER 3. TRANSACTION PRIORITIZATION NORMS
-
Transaction Prioritization Norms
3.1 Methodology
3.2 Analyzing norm adherence
3.3 Investigating norm violations
3.4 Dark-fee transactions
3.5 Concluding remarks
CHAPTER 4. TRANSACTION PRIORITIZATION AND CONTENTION TRANSPARENCY
-
Transaction Prioritization and Contention Transparency
4.1 Methodology
4.2 On contention transparency
4.3 On prioritization transparency
4.4 Concluding remarks
CHAPTER 5. DECENTRALIZED GOVERNANCE
-
Decentralized Governance
5.1 Methodology
5.2 Attacks on governance
5.3 Compound’s governance
5.4 Concluding remarks
CHAPTER 6. RELATED WORK
6.1 Transaction prioritization norms
6.2 Transaction prioritization and contention transparency
6.3 Decentralized governance
CHAPTER 7. DISCUSSION, LIMITATIONS & FUTURE WORK
7.1 Transaction ordering
7.2 Transaction transparency
7.3 Voting power distribution to amend smart contracts
Conclusion
Appendices
APPENDIX A: Additional Analysis of Transactions Prioritization Norms
APPENDIX B: Additional analysis of transactions prioritization and contention transparency
APPENDIX C: Additional Analysis of Distribution of Voting Power
Bibliography
Conclusion
In this thesis, we adopted a data-driven approach to examine fairness within blockchain contexts, focusing on three key aspects: (i) Fairness in ordering; (ii) Fairness in transparency; and (iii) Fairness in voting power to amend smart contract applications.
Our findings reveal a discrepancy between assumed prioritization norms and actual practices within the blockchain community. In particular, miners often deviate from these norms by prioritizing transactions that serve their own interests or friendly miners. This contradicts the principle of exclusively fee-based prioritization.
Through active experiments, we have uncovered instances of miner collusion involving dark-fee transactions. These transactions provide miners with off-chain incentives in a non-transparent manner, contributing to a lack of transparency in the ecosystem. These fees are kept private between the miner and the issuer of a particular transaction, even after the transaction is confirmed on the blockchain. This exacerbates the challenge of accurately estimating fees. As a result, transaction issuers struggle to determine appropriate fees because they do not have a complete view of all transaction fees being offered.
In addition, blockchain applications, or smart contracts, are often amended by governance protocols. These protocols aim to distribute decision-making power among participants. However, we show that the concentration of voting power based on token ownership skews the dynamics of decision-making. A small subset of participants with a significant token stake wields disproportionate influence, allowing them to shape proposals and votes in line with their self-interest. This practice undermines the true decentralization of decision-making power in the blockchain ecosystem.
We believe that our findings provide valuable insights for designing new and more fair blockchains. Additionally, to ensure the reproducibility of our results, we have made the code and data sets used in this thesis publicly available (Messias, 2023a,b).
APPENDIX A: Additional Analysis of Transactions Prioritization Norms
A.1 Congestion in Mempool of data set B
Congestion in Mempool is typical not only in A (as discussed in §3.2.1), but also in B. Indeed, Figure A.1 reveals a huge variance in Mempool congestion, much higher than that observed in A. Mempool size fluctuations in B are, for instance, approximately three times higher than that in A (with the size of unconfirmed transactions at one point in time exceeding almost 50 times the maximum block size). Around June 22nd, there was a surge in Bitcoin price following the announcements of Facebook’s Libra[21] and another surge around June 25th after the news of US dollar depreciation (Paul R. La Monica, 2019). These price surges significantly increased the number of transaction issued, which in turn introduced delays. As a consequence, at times, Mempool in B takes much longer duration than in A to be drained of all transactions.
A.2 Significance of transaction fees
Table A.1 shows the contribution of transaction fees towards miners’ revenue across all blocks mined from 2016 to 2020. In 2018, fees accounted for an average of 3.19% of miners’ total revenue per block; in 2019 and 2020 were 2.75% and 6.29%, respectively. However, if we consider only blocks mined from May 2020 (i.e., blocks with a mining reward of 6.25 BTC), the fees account for, on average, 8.90% with an std. of 6.54% in total. Therefore, revenue from transaction fees is increasing (Easley et al., 2017), and it tends to continue.


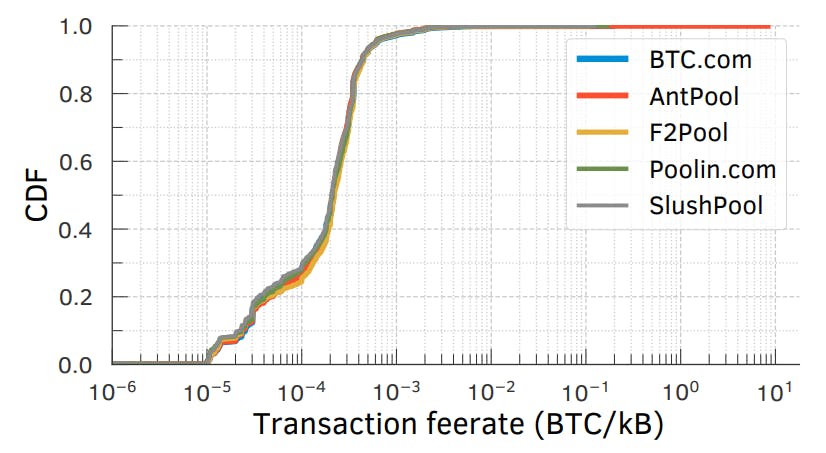
A.3 Transaction fee rates across mining pools


A.4 On fee rates and congestion
In Figure A.3, we show the fee rates of transactions observed in 4 different bins or congestion levels in data set B. Each bin in the plot corresponds to a specific level of congestion identified by the Mempool size: lower than 1 MB (no congestion), in (1, 2] MB (lowest congestion), in (2, 4] MB, and higher than 4 MB (highest congestion). Fee rates at high congestion levels are strictly higher (in distribution, and hence also on average)


than those at low congestion levels. Users, therefore, increase transaction fees to mitigate the delays incurred during congestion.


A.5 Child-Pays-For-Parent (CPFP) Transactions


A.6 Miners’ behavior during the scam
To examine the miners’ behavior during the Twitter scam attack from July 14th to August 9 th, 2020, we selected all blocks mined (3697 in total, containing 8,318,621 issued transactions) during this time period from our data set C. If we rank the MPOs responsible for these blocks by the number of blocks (B) mined (or, essentially, the approximate hashing capacity h), the top five MPOs (refer Figure A.5) turn out to be Poolin (B: 565; h: 15.28%), F2Pool (B: 536; h: 14.5%), BTC.com (B: 424; h: 11.47%), AntPool (B: 404; h: 10.93%), and Huobi (B: 353; h: 9.55%)
A.7 Transaction-acceleration fees
In this experiment, we compare the transaction-acceleration fee with the typical transaction fees in Bitcoin. To this end, we retrieved a snapshot containing 26,332 unconfirmed transactions from our node’s Mempool on November 24th 2020 at 10:08:41 UTC. Then, for each transaction, we searched its respective transaction accelerator price (or acceleration fee) via the acceleration service provided by BTC.com (BTC.com, 2022). We inferred the acceleration fees for 23,341 (88.64%) out of the 26,332 unconfirmed transactions. Figure A.6 shows the CDF of both the Bitcoin transaction fees and the acceleration fees provided by BTC.com. Acceleration fee is on average 566.3 times higher (4734.67 of std.) and on median 116.64 times higher than the Bitcoin transaction fees. At the time of this experiment, 1 BTC was worth 18,875.10 USD.
Author:
(1) Johnnatan Messias Peixoto Afonso
[21] On June 18th, Facebook announced its cryptocurrency, Libra, which was later renamed to Diem. https://www.diem.com


