
Key takeaways
- What is social media analytics? It’s the process of collecting, analyzing, and reporting on data from social platforms to measure performance and inform strategy across owned, earned, and paid social.
- The main types of social media analytics include performance analytics, audience analytics, competitive analysis, sentiment analysis, social listening, paid social analytics, and influencer analytics.
- Tracking the right metrics matters more than tracking all of them. Engagement rate, conversions, sentiment, and share of voice help enterprise teams prove ROI and justify budget to leadership.
- An effective analytics strategy starts with clear goals, the right KPIs, a unified tool, and a consistent reporting cadence that connects social performance to business outcomes.
Social media analytics means the collection, analysis, and reporting of data points that help you measure the performance of your social media accounts and guide business decisions.
These are the KPIs and metrics that will help you assess and refine your social media marketing strategy on both macro and micro levels. That includes data from your own content (owned), conversations about your brand (earned), and your ad campaigns (paid).
For enterprise teams, analytics goes beyond what’s available in native platform dashboards. It often means integrating social media data with web analytics, CRM systems, and business intelligence tools to get a unified view of performance across brands, regions, and channels.
At a conceptual level, there are four analytical approaches that apply to social media data:
- Descriptive: What happened? (e.g., engagement dropped 12% last month)
- Diagnostic: Why did it happen? (e.g., posting frequency decreased during a team transition)
- Predictive: What’s likely to happen next? (e.g., engagement will rebound if posting cadence returns to normal)
- Prescriptive: What should we do about it? (e.g., schedule content in advance to maintain consistency)
Understanding these four approaches helps you move from simply reporting numbers to actually using social media data to drive decisions.
Social media analytics connects your social performance to business outcomes. Without it, you’re making content decisions based on gut instinct rather than evidence. Here’s why it matters for marketing teams at every level.
How does it help you understand performance?
Social media analytics provide a wealth of information about how your content is performing. Exactly what you track depends on what goals you’re trying to achieve, and the associated metrics that track those results.
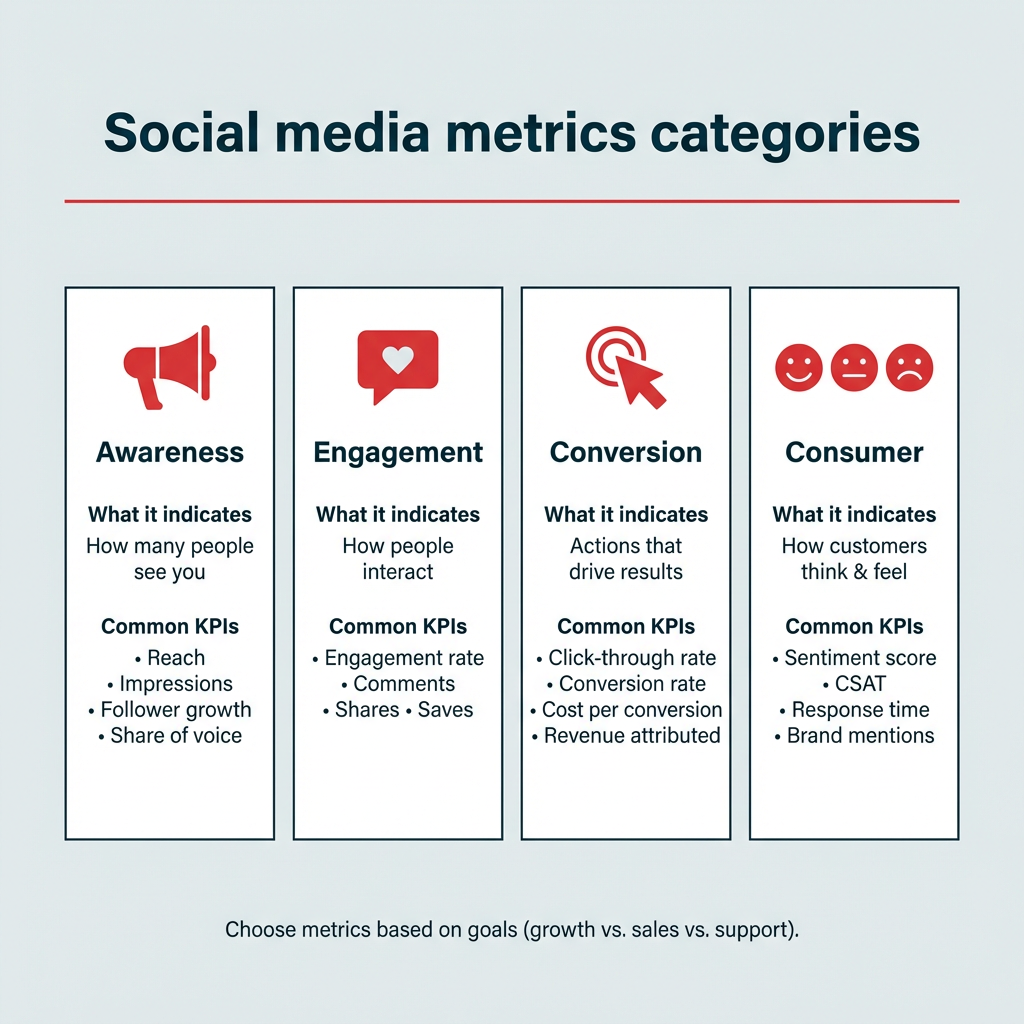
Social media metrics generally fall into one of four categories:
- Awareness: Current and potential audience.
- Engagement: How audiences are interacting with your content.
- Conversion: How audiences convert to customers, subscribers, or leads.
- Consumer: How active customers think and feel about your brand.
If your goal is to grow your following, then engagement metrics (like follows and likes) are important. If your goal is sales, conversion-related metrics are more relevant. These might include views or click-through rates. With a dedicated tool like Hootsuite Advanced Analytics, you can even track conversion events back to specific social posts.

Enterprise teams especially benefit from cross-platform views that pull all of this data into one place, rather than toggling between native dashboards for each channel.
Social media analytics help you gauge customer sentiment, spot trends, and avoid PR crises before they happen.
How does it help you know your audience?
The best way to create content that resonates with your target audience is to develop a deep understanding of who your audience is. Social media analytics help you understand your audience demographics. This enables better decisions about your content strategy.

For example, Gen Z is much more concerned with a brand’s aesthetics and vibes than Baby Boomers. Boomers, on the other hand, are much more interested in inspirational content.

Source: Hootsuite Consumer Report
Knowing whether you’re marketing to Boomers or Gen Z gives you a better framework for content decisions.
Analytics also help you understand:
- Segmentation of your audience into meaningful groups
- Where in the world your audience lives
- The languages they speak
- Brand mentions and how customers perceive your brand
- Their top interests and online behaviors
You can even use analytics to get custom reports indicating when your audience is most likely to be active on each channel, and when is the best time to post based on your specific social media goals.
How does it improve campaigns and ad spend?
Social analytics give you a full picture of content performance on each of your social platforms, helping you refine your marketing campaigns and optimize over time. That applies to both organic content and paid ads.
You can see in real time when content performs above or below your baseline. You’ll also be able to spot upward and downward trends early.
From there, you can then work backwards from this data to figure out why you’re seeing these specific results. Look for trends or spikes correlated to different formats of content (photo, video, etc.), tone, topic, and time of day.
Once you develop a theory based on your data from social channels, you can create an A/B test to see whether your hypothesis is correct. Again, analytics provide the data you need to understand which of your test variants is more effective.

On the paid side, look for analytics tools that let you track organic and paid social content side by side. When you see an organic post performing better than usual, you can use your social ads budget to boost it to a wider audience. And if an ad is underperforming mid-campaign, you can reallocate budget in real time rather than letting it run its course.
All of this gives you an up-to-date understanding of what works on your social channels, for your specific audience, so you can refine your strategy and campaign direction over time.
How does it prove ROI and justify budget?
Social media metrics such as likes and follows can seem a little ethereal. We’d argue this isn’t exactly fair, since 58% of people say that following a brand on social media impacts their purchasing decisions. Social media analytics help you prove the social-to-purchase pipeline to stakeholders by providing actionable insights.
Look for a powerful social media analytics tool that can track revenue, leads, and conversions driven by social media. And when you can tie value-driving events back to a specific social media post or campaign, you clearly highlight the value of every aspect of your work.
What’s the most powerful way to justify further investments in your social strategy and growing your team? Show exactly how much value your company gains from the investment it’s currently making, especially when 63% of CMOs cite budget and resource constraints as their top challenge.
Social media analytics reports give you this data in black and white (or in colorful visualization graphs, if that’s more your style). Help budget decision-makers understand that social marketing teams are a profit center rather than a cost center. This shift in thinking will increase willingness to give your team the resources it needs to execute your bold strategic plans.
In short, social media ROI tracking turns social from a “nice to have” into a measurable business driver.
#1 Analytics Tool for Growth
Beautiful reports. Clear data. Actionable insights to help you grow faster.
Start your free trial
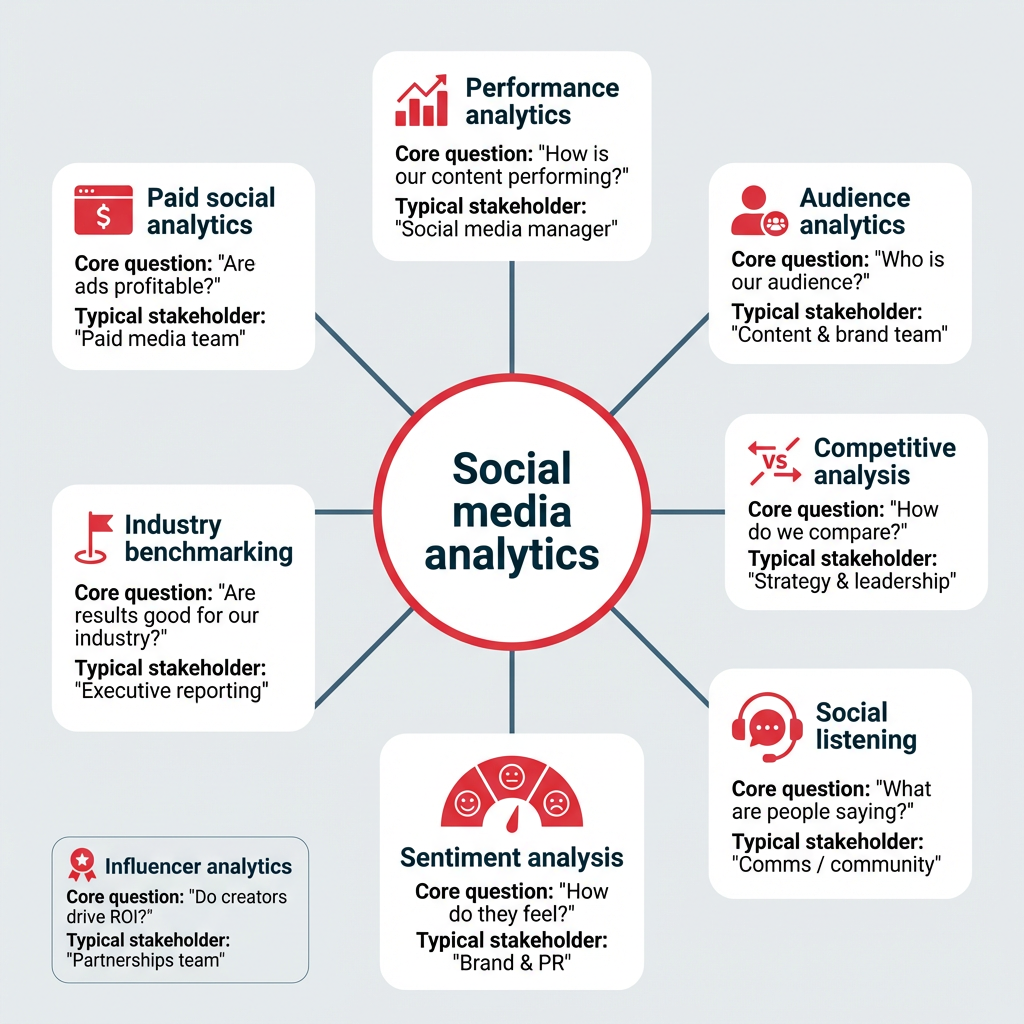
Social media analytics is an umbrella term that covers several distinct types of analysis. Each one answers a different question about your social presence. Here are the seven main types:
- Performance analytics: How is your content performing?
- Audience analytics: Who is your audience?
- Competitive analysis: How do you compare to competitors?
- Social listening and sentiment analysis: What are people saying about you, and how do they feel?
- Industry benchmarking: How do you stack up against your industry?
- Paid social analytics: How are your ad campaigns performing?
- Influencer analytics: How effective are your influencer partnerships?
Performance analytics
Performance analytics is the most fundamental form of social media analysis. It means tracking your own metrics, such as engagement rate, reach, impressions, and follower growth, to see how your social posts are performing.
This applies to both organic and paid social content. At the post level, you’re looking at which individual pieces of content resonate. At the profile level, you’re tracking overall account health and growth trends over time.
Audience analytics
Audience analytics focuses specifically on who your followers and engaged users are. This includes demographic and behavioral data (age, gender, location, when they’re online, what content they interact with), and psychographic data (interests, values).
Understanding your audience at this level helps you create content that resonates, choose the right platforms, and target paid campaigns more effectively. For enterprise teams managing multiple brands or regions, audience analytics can reveal important differences between segments that should inform distinct content strategies.
Competitive analysis
Competitive analysis means looking at your results compared to specific competitors in your industry niche. This gives you the context to understand your own results better.
It typically includes comparing share of voice, content benchmarking (what formats and topics competitors use), and engagement rates. Knowing where you outperform competitors and where you fall behind helps you prioritize your efforts and sharpen your competitive intelligence.
Social listening and sentiment analysis
Social listening means monitoring mentions and discussion of your brand, relevant hashtags, and trending topics to understand what people are saying about you online. Watch for trends and spikes to identify sudden shifts you need to address.
Sentiment analysis goes a step further. It moves beyond the numbers to understand how people feel about your brand. Engagement metrics alone are worth digging into, but those numbers are far more powerful when combined with an understanding of the intent behind the conversation.
Together, listening and sentiment analysis give you a complete picture of your brand’s reputation. Hootsuite’s Talkwalker-powered listening capabilities, for example, can surface these insights across social platforms, news, blogs, and forums in one place.

#1 Easy Social Listening
Brand mentions, trending topics, and sentiment at your fingertips. Enhance your social strategy with the insights that matter.
Start your free trial
Industry benchmarking
Industry benchmarking compares your performance against the industry as a whole, rather than specific competitors. This provides valuable context, especially for overall trends.

For enterprise teams reporting to the C-suite, benchmarking data is especially useful. It answers the question leadership always asks: “Are these results actually good?” Having industry-level context makes your reporting more credible and your recommendations more persuasive.
Looking for recent stats? Head to our breakdown of social media benchmarks for 13 major industries.
Paid social analytics
Paid social analytics tracks the performance of your advertising campaigns across social platforms, over $121 billion in U.S. ad spend in 2026. Key metrics include cost per click (CPC), cost per thousand impressions (CPM), return on ad spend (ROAS), and conversion rate.
The real power comes from analyzing organic and paid performance side by side. When you can see which organic posts are already resonating, you can make smarter decisions about where to put your ad budget. And tracking paid results alongside organic gives you a complete picture of your social media ROI.
Influencer analytics
Influencer analytics measures the performance of your influencer partnerships. This includes tracking engagement rate on sponsored content, reach, conversions driven by influencer posts, and cost per engagement.
As influencer marketing budgets grow, so does the need to prove these partnerships deliver results. Influencer analytics helps you identify which creators drive real business value and which ones aren’t worth the investment.
Here’s a quick comparison of all seven types:
|
Type |
What it measures |
Key metrics |
Example use case |
|---|---|---|---|
|
Performance analytics |
Your own content performance |
Engagement rate, reach, impressions |
Identifying your top-performing post formats |
|
Audience analytics |
Who your audience is |
Demographics, interests, active times |
Tailoring content for different age groups |
|
Competitive analysis |
Performance vs. competitors |
Share of voice, engagement comparison |
Spotting content gaps competitors are filling |
|
Social listening and sentiment |
Brand conversations and feeling |
Mention volume, sentiment score |
Catching a PR issue before it escalates |
|
Industry benchmarking |
Performance vs. industry averages |
Engagement rate benchmarks by platform |
Proving to leadership that results are above average |
|
Paid social analytics |
Ad campaign performance |
CPC, CPM, ROAS, conversion rate |
Reallocating budget to top-performing ads |
|
Influencer analytics |
Influencer partnership ROI |
Engagement rate, conversions, cost per engagement |
Deciding which creators to renew contracts with |
The metrics you track should align with your business goals. Tracking everything leads to dashboard overload. Tracking the right things leads to better decisions. Here’s a framework that maps common business goals to the metrics that actually matter.
|
Business goal |
Key metrics |
Why it matters |
|---|---|---|
|
Brand awareness |
Reach, impressions, follower growth, share of voice |
Shows how many people are seeing your brand and whether that audience is growing |
|
Engagement |
Engagement rate, comments, shares, saves |
Reveals whether your content resonates enough for people to interact with it |
|
Conversions |
Click-through rate, conversion rate, cost per conversion, revenue attributed |
Connects social activity directly to business outcomes like leads and sales |
|
Customer experience |
Response time, sentiment score, CSAT |
Measures how well your social team supports and satisfies customers |
|
Brand health |
Brand mentions, sentiment trend, share of voice vs. competitors |
Tracks your reputation over time and flags potential issues early |
A good rule of thumb: choose 3-5 KPIs per goal. That’s enough to get a clear picture without drowning in data. Your engagement rate and conversion metrics will likely be the ones leadership cares about most, so make sure those are front and center in your reporting.
The metrics you choose will also depend on the platform. A high save rate matters on Instagram. Watch time matters on YouTube. Shares matter on LinkedIn. Tailor your tracking to each channel’s strengths.
Having access to analytics is one thing. Using them consistently and strategically is another. Here’s a six-step framework for building an analytics process that actually drives results.
- Set clear goals tied to business outcomes
- Choose the right metrics for each goal
- Select a unified analytics tool
- Set your reporting cadence
- Analyze data and take action
- Report results to stakeholders
1. Set clear goals tied to business outcomes
Every analytics strategy starts with knowing what you’re trying to achieve. Your social media goals should ladder up to broader business objectives, whether that’s driving revenue, generating leads, building brand awareness, or improving customer satisfaction.
Be specific. “Increase engagement” is vague. “Increase Instagram engagement rate by 15% in Q2 to support our product launch” gives your team something concrete to measure against.
2. Choose the right metrics for each goal
Once your goals are clear, select the metrics that actually track progress toward them. Refer to the goal-to-metrics table above as a starting point.
The key is restraint. Tracking too many metrics dilutes your focus. Pick the 3-5 KPIs that most directly reflect whether your strategy is working, and let those guide your reporting and optimization.
3. Select a unified analytics tool
Enterprise teams managing multiple platforms, brands, or regions need a single place to view and compare performance. Toggling between native dashboards for each channel is time-consuming and makes it harder to spot cross-platform trends.
A unified tool like Hootsuite brings cross-platform reporting, competitive benchmarking, and ROI tracking into one dashboard, so your team spends less time gathering data and more time acting on it.
4. Set your reporting cadence
How often you look at your analytics, and when, depends on factors like:
Most social media managers take quick peeks at their analytics multiple times per week, or even every day. Early in the week, analytics provide data for planning the week ahead. End-of-week reporting is used to review the week’s results and look for lessons learned.
The best time really depends on your team’s reporting cadence. For example, our team reviews analytics every Monday morning so that last week’s performance is top of mind and we can adjust strategies accordingly.
More in-depth reporting on a monthly basis can help you understand the bigger picture.
“Daily, we track the basic metrics (engagement, reach, and clicks) so we can spot any sudden spikes or drops,” says Tom Edwards, Founder of Bit Quirky Consulting.
Edwards adds: “Mondays are for reviewing weekend performance. But we reserve Fridays for more in-depth analysis to assess weekly trends. At the end of each month, we dive into more detailed reporting, including benchmarking against industry standards. This is when we determine whether we need to shift our content strategy or double down on tactics that worked.”
It may also make sense to time your analytics reviews to specific moments in a campaign rather than days of the week.
“I review analytics within the timelines of campaigns or content launches,” says Ashot Nanayan, CEO and Founder of DWI. “So, if I promote a special offer, I check the metrics a day after the post and repeat the process on the seventh day to understand both the immediate and long-term results.”
A consistent reporting cadence keeps your team aligned and ensures insights don’t fall through the cracks.
5. Analyze data and take action
There’s something to learn from every check of your social media analytics, but you can’t leap into action every time the numbers move a little. So when is it time to act?
Depending on how often you create new content, you might time your analytics review to align with individual posts.
“We make an effort to monitor analytics at frequent enough intervals to notice any trends as they are taking place,” says Jordan Dennison, Digital Marketing Executive at Growthlabs. “This typically involves checks of content within the hour of it being published, the following morning, and then at the end of the week.”
“During one of our seasonal sales campaigns last year, I noticed a 15% drop in engagement midway through,” says Reilly James, Marketing Manager and E-commerce Optimization Expert at William Morris Wallpaper.
“We switched up our messaging to be more direct, highlighting exclusive time-sensitive discounts, and adjusted the creative to feature more vibrant, attention-grabbing colors. Within a few days, engagement rebounded by 10%, and we saw a subsequent uptick in conversions as well.”
In general, keep an eye out for significant spikes and drops, as well as emerging trends you can incorporate into your strategic planning.
Whether you’re looking to recreate success or to get things back on track after a dip, use your analytics to identify elements for testing. Once you’ve created your new content, cycle back into the analytics to see how your experiments fare.
6. Report results to stakeholders
Analytics only create value when they’re shared with the people who make decisions. Build reports that connect social metrics to business outcomes, not just platform vanity metrics.
A few tips for effective stakeholder reporting:
- Lead with business impact (revenue, leads, conversions) before platform metrics
- Use visualizations to make trends easy to grasp at a glance
- Include competitive context so leadership understands how results compare
- Automate delivery so reports arrive on a consistent schedule
Hootsuite lets you create custom reports and schedule them to land in any stakeholder’s inbox automatically, so you never miss a reporting window.
AI is reshaping how marketing teams work with social media data. With 81% of marketing technology leaders now piloting or implementing AI agents, teams can surface insights faster and act on them sooner instead of spending hours pulling reports and looking for patterns manually. Here are the key ways AI is transforming analytics:
- Automated anomaly detection: AI can flag unusual spikes or drops in performance the moment they happen, so your team can respond before a small issue becomes a big one.
- Predictive analytics: Rather than just reporting on what happened, predictive analytics tools can forecast trends, helping you anticipate audience behavior and plan content accordingly.
- Natural language reporting: AI-generated summaries translate complex data into plain-language insights, making it easier to share results with stakeholders who don’t live in dashboards.
- Content recommendations: AI analyzes historical performance data to suggest what types of content, topics, and posting times are most likely to drive results for your specific audience.
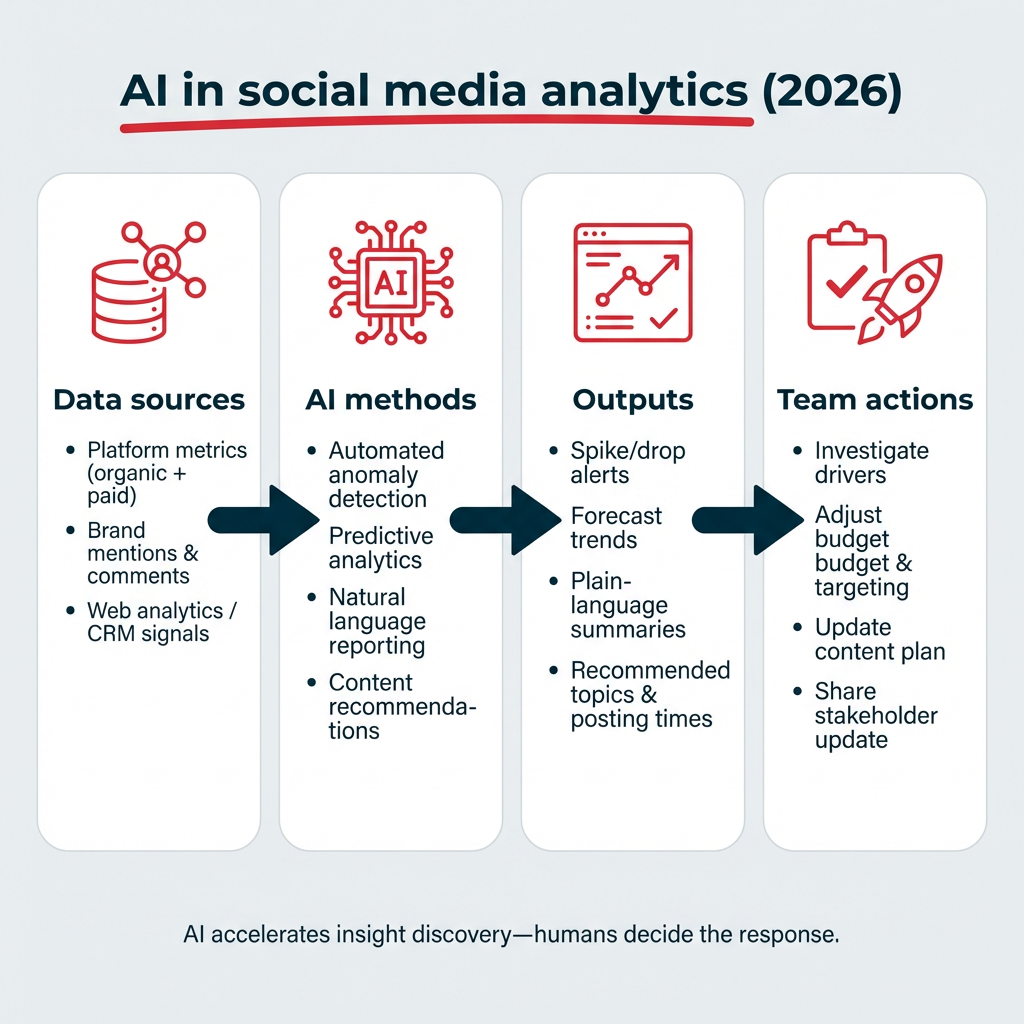
Hootsuite integrates AI across its analytics and content workflows, from OwlyWriter AI for content creation to Talkwalker-powered intelligence for listening and trend detection. The goal isn’t to replace human judgment, but to give your team better data, faster.
Even with the right tools, social media analytics can be tricky to get right. Here are the most common challenges enterprise teams face, and how to address them:
- Data silos across platforms: When each platform has its own native dashboard, it’s hard to get a unified view of performance. The fix: use a centralized analytics tool that pulls data from all channels into one place.
- Connecting social metrics to business revenue: Leadership wants to see dollars, not likes. The fix: set up conversion tracking and UTM parameters so you can attribute revenue and leads back to specific social activity.
- Data privacy and compliance: Regulations like GDPR and CCPA affect how you collect and use audience data. The fix: work with your legal team to ensure your analytics practices comply with applicable regulations, and choose tools with enterprise governance features like role-based access and audit trails.
- Analytics literacy across teams: Not everyone on your team (or in leadership) knows how to interpret social data. The fix: create standardized reporting templates with clear definitions, and invest in training so insights are understood and acted on.
Addressing these challenges early prevents wasted effort and ensures your analytics practice scales with your team.
The right analytics tool depends on your team’s size, the platforms you manage, and how deeply you need to analyze performance. Here’s a look at three strong options, plus a note on native platform analytics.
Hootsuite
Hootsuite is a comprehensive social media management tool that offers powerful social media analytics with cross-platform reporting for Facebook, Instagram, TikTok, X, Pinterest, YouTube, and LinkedIn.
You can track critical post and profile metrics like engagement, clicks, and follower growth. But you can also create custom reports that zero in on the metrics you care about.

For example, you could create different reporting templates for daily, weekly, and monthly check-ins. Or, you could create separate reports for your own social media analysis, for your team, and for stakeholders. Once you’ve set the reports up, you can schedule them to come to your inbox (or anyone else’s) automatically, so you never forget to review your data.
You can track ROI and conversions, dive into competitive benchmarking and industry benchmarking, and even track the productivity of your social team. Talkwalker-powered social listening is built in, and AI-powered insights help surface trends and anomalies without manual digging. For enterprise teams, Hootsuite also integrates with Salesforce, Adobe, and other business systems. You’ll be all set for budget planning and negotiations.
Google Analytics
Google Analytics complements your social media analytics tools by tracking what happens after someone clicks through from a social post to your website. You can measure social referral traffic, conversions from social channels, and user behavior on your site.
Using UTM parameters on your social links lets you attribute specific website actions back to individual posts or campaigns. It’s a free, essential layer of analytics that connects social performance to on-site business outcomes.
Rival IQ

Source: Rival IQ
Rival IQ is a stats-heavy social media analytics tool that specializes in competitive benchmarking and social media audits. It offers plenty of data and custom reports, making it a strong choice for teams that want to understand how they stack up against specific competitors. This is an intermediate-level tool with great features for both big-picture trends and detailed post-level analysis.
Here’s a quick comparison of these tools:
|
Tool |
Best for |
Key analytics features |
Pricing tier |
|---|---|---|---|
|
Hootsuite |
Enterprise teams managing multiple platforms |
Cross-platform reporting, ROI tracking, competitive benchmarking, AI insights, social listening |
Paid (free trial available) |
|
Google Analytics |
Tracking social referral traffic and on-site conversions |
Social traffic attribution, conversion tracking, UTM support |
Free |
|
Rival IQ |
Competitive benchmarking and social audits |
Competitor comparison, engagement benchmarks, custom reports |
Paid |
All of the major social media platforms also offer native analytics tools. These provide stats about your performance on that individual channel. While this is a rather time-consuming way to gather your social media data across multiple platforms, it’s also free. We’ve created in-depth guides for how to use the native analytics on the following platforms:
For a more comprehensive breakdown, check out our list of the best social media analytics tools, with a full comparison of pricing and features.
Frequently asked questions
What is social media analytics?
Social media analytics is the process of collecting and analyzing data from social platforms to measure performance and guide business decisions. It covers everything from tracking your own post metrics to monitoring brand sentiment and benchmarking against competitors.
What are the 4 types of social media analytics?
The four types of social media analytics are descriptive (what happened), diagnostic (why it happened), predictive (what will happen), and prescriptive (what to do about it). These four approaches form a framework that helps teams move from reporting on past results to making forward-looking strategic decisions.
What metrics should you track for social media analytics?
The metrics you track for social media analytics depend on your goals. The most common include engagement rate, reach, impressions, click-through rate, conversion rate, and sentiment score. Choose 3-5 KPIs per goal to keep your reporting focused and actionable.
How do you measure social media ROI?
You measure social media ROI by tracking conversions, revenue, and leads that can be attributed to social media activity, then comparing that value against your total social media spend. Tools like Hootsuite Advanced Analytics let you trace conversion events back to specific posts and campaigns.
What is the best social media analytics tool?
The best social media analytics tool depends on your team’s size and needs. Enterprise teams typically need a platform like Hootsuite that unifies cross-platform reporting, competitive benchmarking, and ROI tracking in one dashboard. Smaller teams may start with native platform analytics or free tools like Google Analytics.
How often should you review social media analytics?
Most social media teams benefit from daily quick checks on key metrics, weekly performance reviews, and monthly in-depth reporting that benchmarks results against goals and industry standards. The right cadence depends on your content volume and campaign timelines.
What is the difference between social media analytics and social listening?
Social media analytics measures the performance of your own content and profiles, while social listening monitors broader conversations, brand mentions, and sentiment across the social web, including content you did not create. Both are valuable, and they work best together.
Can you use Google Analytics for social media?
Yes, you can use Google Analytics for social media tracking. It measures social referral traffic, conversions from social channels, and user behavior after someone clicks through from a social post to your website. Pair it with UTM parameters for the most accurate attribution.
What is sentiment analysis in social media?
Sentiment analysis in social media uses natural language processing to determine whether online mentions and conversations about your brand are positive, negative, or neutral. It adds emotional context to your engagement data, helping you understand not just how much people are talking, but how they feel.
How is AI used in social media analytics?
AI is used in social media analytics to automate reporting, detect anomalies and trends in real time, predict future performance, and generate content recommendations based on historical data. These capabilities help teams surface insights faster and make more informed decisions without manual data crunching.
Save time managing your social media presence with Hootsuite. Publish and schedule posts, find relevant conversions, engage your audience, measure results, and more — all from one dashboard. Try it free today.


