Table of Links
Abstract and 1 Introduction
2 Background and 2.1 Blockchain
2.2 Transactions
3 Motivating Example
4 Computing Transaction Processing Times
5 Data Collection and 5.1 Data Sources
5.2 Approach
6 Results
6.1 RQ1: How long does it take to process a transaction in Ethereum?
6.2 RQ2: How accurate are the estimates for transaction processing time provided by Etherscan and EthGasStation?
7 Can a simpler model be derived? A post-hoc study
8 Implications
8.1 How about end-users?
9 Related Work
10 Threats to Validity
11 Conclusion, Disclaimer, and References
A. COMPUTING TRANSACTION PROCESSING TIMES
A.1 Pending timestamp
A.2 Processed timestamp
B. RQ1: GAS PRICE DISTRIBUTION FOR EACH GAS PRICE CATEGORY
B.1 Sensitivity Analysis on Block Lookback
C. RQ2: SUMMARY OF ACCURACY STATISTICS FOR THE PREDICTION MODELS
D. POST-HOC STUDY: SUMMARY OF ACCURACY STATISTICS FOR THE PREDICTION MODELS
10 THREATS TO VALIDITY
Construct Validity. As we discovered that the block timestamp is not an accurate representation of when the block was exactly appended to the chain (Section A.2.1), we opt to define the block timestamp as when a new block appears in the Latest Block list of Etherscan. This specifically depends on when one of Etherscan’s nodes becomes aware of the block being processed. As a result, the processed timestamp that we collect from Etherscan likely has a small, somewhat constant error (lag) compared to the actual, real, processed timestamp. This lag (𝜀) embeds three elements: (i) the time for Etherscan to become aware of the new block (information propagation in the blockchain P2P network), (ii) the time it takes for Etherscan to update the webpage, and (iii) the time it takes for us to retrieve the information from the webpage. As a result, we train our model with this “lagged” data. The predictions done by our model thus embed such a lag. That is, the predictions of our model are overestimated by a small 𝜀.
Nevertheless, we emphasize Etherscan is the most popular Ethereum dashboard and numerous tools rely on Etherscan to determine whether a certain transaction 𝑡 has been mined. If 𝑡 has been mined, but it hasn’t been acknowledged and/or advertised by Etherscan yet, then many would simply consider the transaction not to have been mined. In that sense, we believe that the small 𝜀 in our estimations play a little role in practice.
Finally, we note that this inaccuracy problem associated with the processed timestamp is not exclusive to our model, as every existing model needs to compute such a timestamp somehow. We conjecture that most of the existing models use the blockchain-recorded timestamp, as it is (i) the most natural choice, (ii) conveniently stored in the blockchain, and (iii) its flaws are not obvious. For instance, since EthGasStation is open source, we managed to inspect its source code and we were able to confirm that it uses the blockchain-recorded timestamp. In fact, we note that EthGasStation even removes negative processing times in their code[20].
The Ethereum blockchain does not keep track of the timestamp at which transactions are submitted. Similarly to the block timestamp, we also relied on Etherscan’s Pending Transaction Page to discover the pending timestamp of a transaction. Therefore, the accuracy of our pending timestamp depends on the accuracy of the data shown by Etherscan.
More generally, this paper employs a best-effort approach to retrieve the pending and processed timestamps of transactions, due to the requirement and challenges involving long term and real time data collection. Future work should investigate the feasibility of devising more robust data collection approaches to collect additional processing time related data over longer periods of time.
In RQ1, we classified gas prices into 5 categories. Our rationale is that gas prices vary substantially (Figure 5) and transaction issuers (e.g., DApp developers) need to reason about these prices. Reasoning about categories is easier than reasoning about specific prices, especially given that a certain price x might be considered high today and then low next week (cryptocurrencies such as Ether are remarkably more volatile than traditional currencies [12, 28]). For instance, popular applications such as Tripadvisor[21] and UberEats[22] also use an ordinal variable (i.e., $/$$/$$$/$$$$) to denote how expensive a certain restaurant is. In our study, we segregate prices into the following straightforward categories: very cheap, cheap, regular, expensive, and very expensive. Nevertheless, any other categorical classification would still be valid provided that it conveys a clear and intuitive separation of prices (e.g., 4 price categories instead of 5).
In RQ2 and in the post-hoc study, we use the Alpha centrality measure to rank prediction models. Alpha centrality is an eigenvector-based graph centrality measure. The use of eigenvectors to rank entities based on pair-wise entity relationships (e.g., entity i wins over entity j) dates back to the XIX century [26] (ranking of players in chess tournaments). Therefore, our approach is far from novel and builds on a solid theory. We also note that we used Alpha centrality in lieu of the more popular Scott-Knott ESD technique[23] [42] because our data does not fully meet the assumptions of the latter – and using unsuitable statistical tests and procedures is a common pitfall in software engineering research [36]. More specifically, both the original Scott-Knott [39] and the ESD variation are inherently parametric and operate on group means in order to form clusters. Our data (absolute error distributions) are long-tailed distributions, with very large outliers. These outliers disturb the clustering process of Scott-Knott and we thus refrain from using it. Nevertheless, we encourage future studies to reinvestigate our results in light of other suitable ranking mechanisms. Indeed, the problem of fair tournament ranking (i.e., devising a fair final ranking of players based on one-on-one match results) is an open research topic, which falls under an umbrella theory called Spectral Ranking [43]. For instance, recent research advances have been published in the field of operations research (applied mathematics) [14].
As part of the Alpha centrality calculation, we build a directed graph using weighted edges. We use an edge weight of 1.0 to denote wins (𝑤𝑤𝑖𝑛) and an edge weight of 0.5 to denote draws (𝑤𝑑𝑟𝑎𝑤). The rationale is that wins should count more than draws. Most importantly, all of our results still hold regardless of the specific choice of 𝑤𝑑𝑟𝑎𝑤 provided that 𝑤𝑑𝑟𝑎𝑤 < 𝑤𝑤𝑖n.
Internal Validity. During our data collection process from Etherscan, we employed a data retrieval mechanism that minimizes the amount of requests that are sent towards such dashboard. As a consequence, we do not collect each and every transaction that is sent to the Ethereum blockchain. This may lead to an imbalance in our processing time data. For example, this may result in obtaining processing times that are mostly common, while not retrieving enough processing times of transactions that are processed at exceptionally fast or extremely slow speeds.
Additionally, in RQ1, we conjectured that the majority of very expensive transactions that took days to be processed (i.e., outliers) were waiting for a preceding pending transaction to be processed. Given the aforementioned characteristics of our data collection, we unfortunately cannot verify this conjecture. More specifically, (i) if a given transaction 𝑡2 is waiting for some transaction 𝑡1 and 𝑡1 was submitted before we started our data collection, then our dataset will not include 𝑡1 and (ii) if two transactions 𝑡1 and 𝑡2 are sent during our data collection period, and 𝑡2 is waiting for 𝑡1, then there is always the chance that our monitor will only capture 𝑡2.
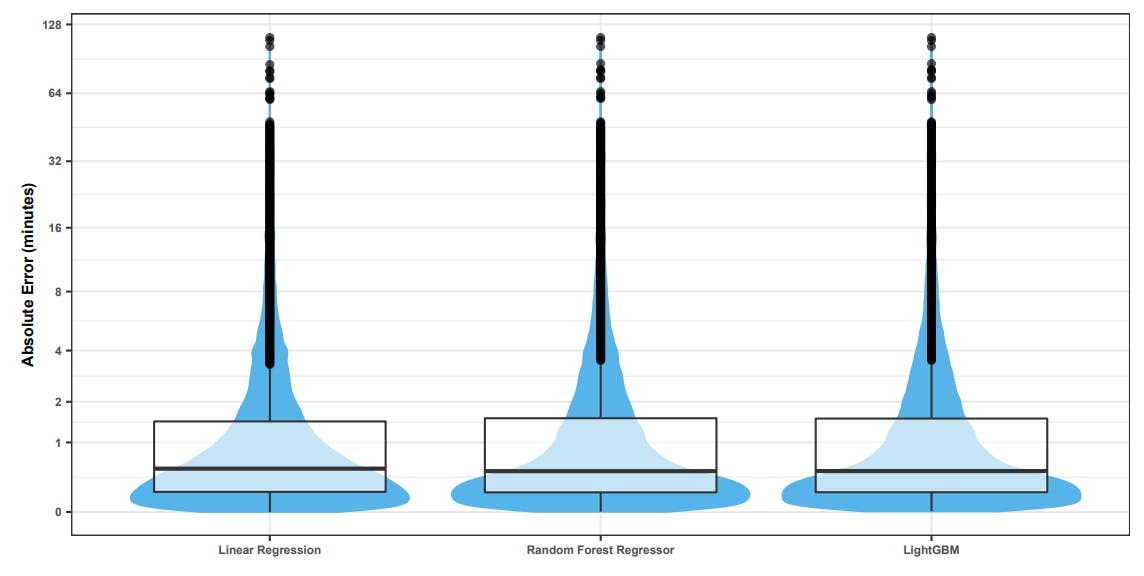
In the post-hoc study, we built a simple linear regression model. In order to understand how the accuracy of our model compares to that of more sophisticated models, we perform an experiment. We choose two machine learning regressors for this comparison: Random Forests and LightGBM. The former has been extensively used in Software Engineering research with good results [19]. The latter is a complex gradient boosting model that has been used by several top contestants in Kaggle Competitions[24]. The results that we obtained are as follows. First, we observe that the models achieve virtually the same performance at the global level (Figure 12). Although a Kruskal-Wallis test (𝛼 = 0.05) indicates that at least one the performance distributions differs from the others, computation of Cliff’s Delta reveals a negligible difference between any given pair of distributions.


Next, we evaluated how the models perform for different price categories. We employ the same ranking approach described in the approach of RQ2. The distributions are shown in Figure 13. We observe that all models rank the same in all price categories. Consequently, we conclude that a linear regression is the best choice, since it is simple and inherently interpretable [31].


Finally, in our study we observe that 0.05% of transactions in our dataset are processed very quickly (e.g., 5 seconds or lower). In these cases, the relative error in our measurements of the prediction accuracy of our models might be high.
External Validity. Our study analyzed data from Ethereum during a specific time window (November 21st 2019 to December 09th 2019). Our results do not generalize to the entire Ethereum transactional history. The main reason is that Ethereum has undergone drastic changes in workload over time (e.g., heavy network congestions during late 2017 due to the boom of the CryptoKitties game [5]). For instance, if our study captured data during the CryptoKitties boom, our results would be bound to a time where the gas prices differ from the majority of gas prices in periods before and after the boom. Hence, regardless of the specific time window chosen to study, it is always possible that the contextual factors of the Ethereum blockchain will change in the future, making generalization extremely difficult. Other contextual factors such as the market capitalization of Ether, the ETH to USD exchange rate, and market speculation also influence how much transaction issuers pay for gas, which then influences transaction processing times. Finally, changes in the protocol introduced in the several hard-forks of Ethereum can also play a role in transaction processing times. We emphasize that a key goal of our paper is to introduce a general and extensible approach for collecting and analyzing transaction processing times (as the actual results per se can always vary across different time frames).
Despite all the aforementioned factors, it still makes sense to determine how representative our window of transactions is. To tackle this problem, we conducted an experiment in which we analyze how the gas prices of transactions inside our analyzed window compare to the gas prices of transactions outside our analyzed window (both past and future). Our rationale is that gas prices serve as a key indicator of the workload state of the network (e.g., EthGasStation). By observing how representative the gas prices of our analyzed window are, we can infer how representative our investigated transactions are (i.e., determine whether they differ from the norm). More specifically, we (i) retrieved all the transactions from our analyzed window, (ii) computed the mean gas price over all such transactions, (iii) defined a gas price boundary corresponding to mean gas price ± 2 std. deviations, (iv) calculated the average gas price per day from the first day of Ethereum (July 30th 2015) until October 25th 2020, and (v) determined how often these daily averages fall within the aforementioned gas price boundary. The results that we obtained are depicted in Figure 14.


Analysis of the figure reveals that transactional activity is concentrated in the three last hard forks (note the percentage beside each hard fork name). When focusing on these three hard forks, we note that 71% of the daily averages fall within our gas price boundary (blue dots). Most of the red dots occur in late Istanbul (May 2020 onwards). The remarkable increase in gas prices is associated with (i) network congestion caused by the boom of the DeFi market (decentralized finance) and (ii) speculation around the release of Ethereum 2.0 [29, 45]. However, a careful analysis of the red dots within the Istanbul period reveals that prices went up, reached a plateau, and are now decreasing. In summary, apart from the unusual, recent surge in gas prices, we conclude that our window of analyzed transactions is a reasonable representation of the normal transactional history of Ethereum in terms of gas prices.
Since the selected time frame will always play a role, we encourage future studies to reuse our study design to analyze different, and possibly larger, time frames. Also, although we choose to analyze gas prices to verify the representativeness of our data as they are known to have a large impact on processing times, there are other features (including those unused by our models), which might have similar levels of predictive power. More generally, future work should extensively evaluate the predictive power of several factors that have the potential to impact transaction processing time, such as gas prices, transaction prioritization algorithms employed by miners, ETH market capitalization (e.g., as proxified by the ETH to USD exchange rate), network hash power (i.e., processing power of the network), and network workload (e.g., number of transactions in the pending pool). Furthermore, our study analyzed data from a specific blockchain platform (Ethereum) during a specific time frame. Hence, our results are unlikely to generalize to other blockchain platforms.
The majority of our study heavily relies on the data provided by Etherscan, which is considered as one of the earliest Ethereum projects aiming to provide equitable access to blockchain data[25]. Although we perform an evaluation of the accuracy of the collected pending timestamps, it is possible that these timestamps are still prone to inaccuracies due to the nature of the P2P characteristics of the network. In particular, the geolocation, propagation delay, and network congestion could affect these timestamps by delaying exactly when nodes from Etherscan first see pending transactions. In turn, we encourage future work to perform a detailed analysis on the impact of geolocation on Etherscan’s measured timestamps (e.g., sending transactions from nodes across different geolocations over long periods of time).
Conclusion validity. The conclusions that we draw in this paper derive directly from the employment of parametric statistical tests and the computation of Cliff’s Delta effect size measures. This is standard practice in Empirical Software Engineering research. In practice, however, DApp developers might use different criteria to compare the accuracy of two candidate models. For instance, the median absolute errors of our proposed model are higher than those of the state-ofthe-practice model for transactions in the expensive and very expensive gas price categories (Table 7). Practitioners may thus choose the state-of-the-practice model for these price categories if they believe that the median absolute error is a more suitable indicator for their use-case compared to Cliff’s Delta.
Authors:
(1) MICHAEL PACHECO, Software Analysis and Intelligence Lab (SAIL) at Queen’s University, Canada;
(2) GUSTAVO A. OLIVA, Software Analysis and Intelligence Lab (SAIL) at Queen’s University, Canada;
(3) GOPI KRISHNAN RAJBAHADUR, Centre for Software Excellence at Huawei, Canada;
(4) AHMED E. HASSAN, Software Analysis and Intelligence Lab (SAIL) at Queen’s University, Canada.
[20] https://github.com/ethgasstation/ethgasstation-backend/blob/master/egs/egs_ref.py#L256
[21] http://www.tripadvisor.com
[22] http://www.ubereats.com
[23] https://github.com/klainfo/ScottKnottESD
[24] https://github.com/microsoft/LightGBM/blob/master/examples/README.md#machine-learning-challenge-winningsolutions
[25] https://etherscan.io/aboutus


