
For decades, the star schema has been the foundation of business intelligence.
Every data warehouse architecture follows the same pattern:
- Fact tables store measurable events
- Dimension tables describe those events
- Analytical queries join them together
The design is elegant and flexible. It allows analysts to slice business metrics across dimensions such as product, store, time, and geography.
For many BI workloads, this architecture still works extremely well.
But modern analytics environments are beginning to expose a challenge that dimensional modeling was never originally designed for: Massive scale combined with continuous query workloads.
The Original Promise of Dimensional Modeling
Traditional BI architectures rely on dimensional modeling inside a data warehouse.
In this design:
- the fact table stores business events
- dimension tables provide descriptive attributes
- BI tools query the model using joins
Example query:
select
  ds.store_id,
  dp.category,
  sum(fs.sales_amount)
from fact_sales as fs
left join dim_product as dp
  on fs.item_id = dp.item_id
left join dim_store as ds
  on fs.store_id = ds.store_id
group by all
This model works well because analysts can explore data across multiple dimensions without needing specialized tables for each question.
When Star Schemas Perform Extremely Well
Star schemas perform especially well when analytical models are loaded into memory.
Many BI tools support this through extract or import models.
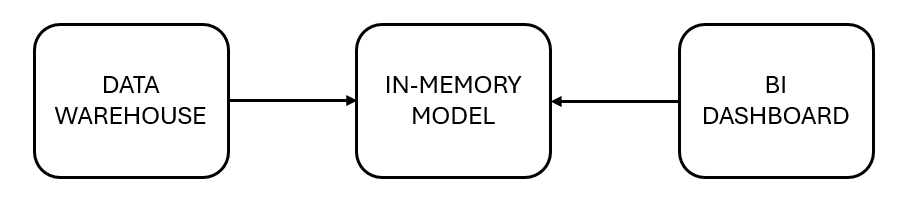
When data is loaded into memory:
- joins execute extremely quickly
- columnar compression reduces storage footprint
- analytical engines optimize query execution
For datasets that fit comfortably in memory, dimensional models remain extremely effective.
This is one reason star schemas became the dominant modeling pattern in BI.
However, not all datasets can be loaded into memory anymore.
The Scale Problem Modern BI Faces
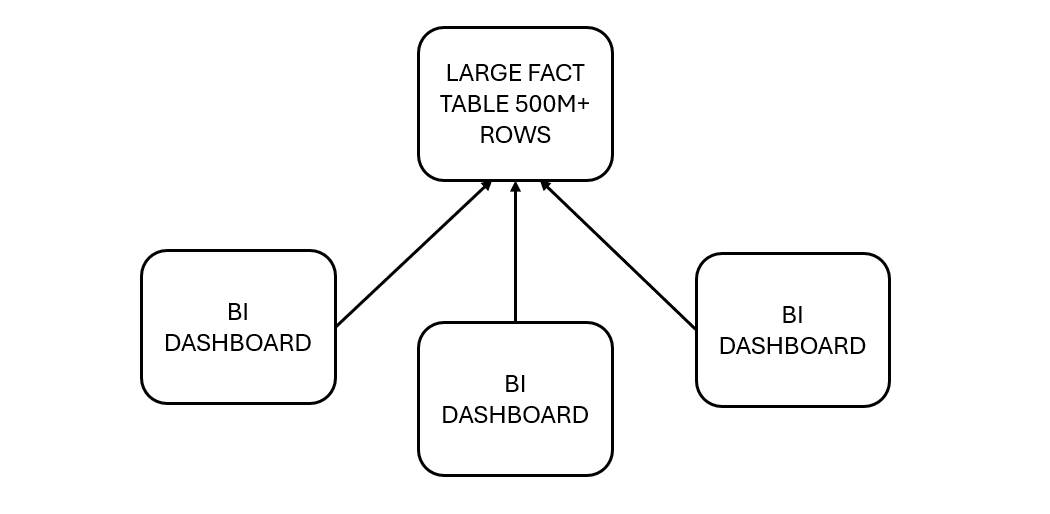
Modern enterprise analytics platforms often operate on datasets containing hundreds of millions or billions of rows.
Consider a transactional dataset with:
500 million sales transactions
Now, imagine dashboards refreshing continuously across hundreds of users.
Each interaction triggers queries that repeatedly perform joins against large fact tables.
The issue is not dimensional modeling itself.
The challenge arises when three factors increase simultaneously:
- Dataset scale
- Query frequency
- Latency expectations
When these factors combine, join-heavy queries become expensive.
The Workaround Most BI Teams Discover
As datasets grow, many BI teams introduce a second layer of data structures.
Instead of querying the star schema directly, dashboards query purpose-built analytical tables.
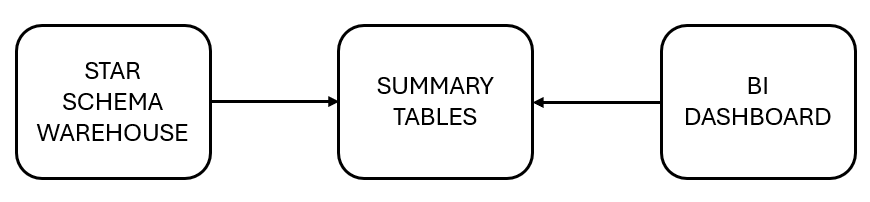
These tables often contain:
- pre-aggregated metrics
- denormalized attributes
- simplified schemas optimized for dashboards
Example:
store_category_sales_summary
Now the dashboard query becomes:
select
  store_id,
  category,
  sum(total_sales)
from store_category_sales_summary
group by all
The benefits are clear:
- fewer joins
- smaller scans
- faster queries
Many organizations implement this pattern through:
- reporting marts
- aggregated tables
- semantic layers
- precomputed datasets
But these structures are usually treated as engineering optimizations rather than a formal modeling strategy.
A Simple Framework for BI Modeling Decisions
Modern analytics workloads require a structured way to decide when dimensional models are sufficient and when additional structures are needed.
One way to think about this is through Modeling Pressure.
Modeling pressure is influenced by four variables:
- Dataset scale – number of rows in the fact table
- Query complexity – number of joins and aggregations
- Query frequency – how often dashboards execute queries
- Latency requirement – how quickly results must be returned
We can think of the modeling pressure conceptually as:
Modeling Pressure = Dataset Scale × Query Complexity × Query Frequency × Latency Requirement
When modeling pressure is low, dimensional models perform well.
When modeling pressure becomes high, purpose-driven analytical tables become increasingly valuable.
Examples Across Industries
This pattern appears across many industries.
Retail Analytics
Retail companies often track hundreds of millions of transactions.
Dashboards monitoring store performance may query:
sales by store by category by week
Repeated joins across massive transaction tables can become expensive.
Retail teams often create summary tables such as:
store_weekly_sales_summary
Digital Analytics
Clickstream platforms process billions of events.
A dashboard analyzing:
page views by device by hour
may rely on pre-aggregated tables instead of raw event logs.
IoT Analytics
Industrial sensors generate millions of readings per hour.
Operational dashboards monitoring machine performance often rely on pre-aggregated telemetry tables instead of raw sensor data.
The Emerging Hybrid BI Architecture
Instead of replacing dimensional models, modern data platforms increasingly adopt hybrid architectures.
In this architecture:
- Operational systems generate raw data
- The warehouse stores dimensional models
- Optimized analytical tables support high-frequency workloads
- Dashboards and AI tools consume optimized data
The warehouse remains the system of record.
Purpose-built analytical tables become the performance layer.
The Real Question BI Teams Should Ask
Dimensional modeling remains one of the most important innovations in business intelligence.
But modern analytics workloads are very different from those of early data warehouses.
Instead of asking:
“Should we use star schemas?”
Modern BI teams should ask:
“When should dimensional models be complemented by purpose-driven analytical structures?”
Understanding that balance may become one of the most important design decisions in modern BI architecture.


