Data transformation and discretization are critical steps in the data preprocessing pipeline. They prepare raw data for analysis by converting it into forms suitable for mining, improving the efficiency and accuracy of data mining algorithms. This article dives deep into the concepts, techniques, and practical applications of data transformation and discretization.
1. What is Data Transformation?
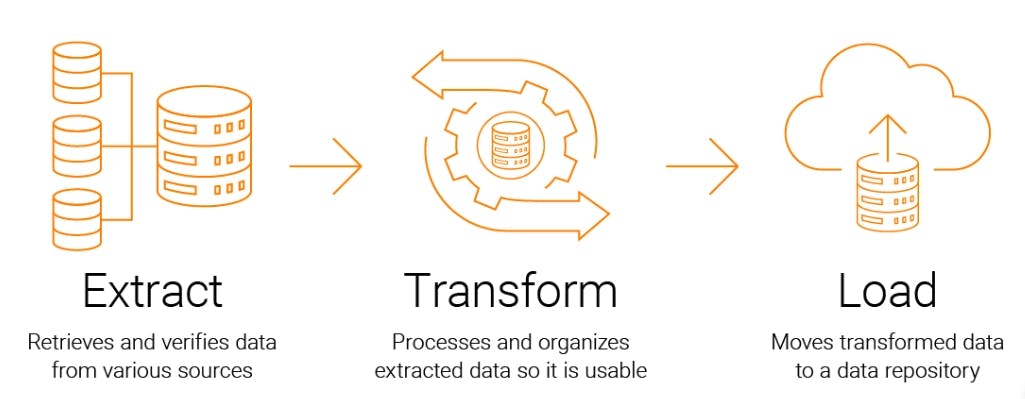
Data transformation involves converting data into appropriate forms for mining. This step is essential because raw data is often noisy, inconsistent, or unsuitable for direct analysis. Common data transformation strategies include:
- Smoothing: Remove noise from the data (e.g., using binning or clustering).
- Attribute Construction: Create new attributes from existing ones (e.g., area = height × width).
- Aggregation: Summarize data (e.g., daily sales → monthly sales).
- Normalization: Scale data to a smaller range (e.g., 0.0 to 1.0).
- Discretization: Replace numeric values with intervals or conceptual labels (e.g., age → “youth,” “adult,” “senior”).
- Concept Hierarchy Generation: Generalize data to higher-level concepts (e.g., street → city → country).
2. Why is Data Transformation Important?
- Improves Data Quality: Removes noise, inconsistencies, and redundancies.
- Enhances Mining Efficiency: Reduces data volume and complexity, speeding up algorithms.
- Facilitates Better Insights: Transforms data into forms that are easier to analyze and interpret.
3. Data Transformation Techniques
3.1 Normalization
Normalization scales numeric attributes to a specific range, such as [0.0, 1.0] or [-1.0, 1.0]. This is particularly useful for distance-based mining algorithms (e.g., k-nearest neighbors, clustering) to prevent attributes with larger ranges from dominating those with smaller ranges.
3.1.1 Min-Max Normalization
-
Formula:
- v*’* : Original value of the attribute.
- minA : Minimum value of attribute A.
- maxA: Maximum value of attribute A.
- new_minA: Minimum value of the new range (e.g., 0.0).
- new_maxA: Maximum value of the new range (e.g., 1.0).
-
Example:
-
Suppose the attribute “income” has a minimum value of $12,000 and a maximum value of $98,000.
-
We want to normalize an income value of $73,600 to the range [0.0, 1.0].
-
The normalized value is 0.716.
-


3.1.2 Z-Score Normalization
3.1.3 Decimal Scaling Normalization
-
Formula:
- j : Smallest integer such that ( max(|v’|) < 1 ).
-
Example:
-
Suppose the attribute “price” has values ranging from -986 to 917.
-
The maximum absolute value is 986.
-
The smallest integer ( j ) such that ( 986 / 10^j < 1 ) is j = 3 .
-
Normalize the value
-
The normalized value is -0.986.
-


3.2 Discretization
Discretization replaces numeric values with interval or conceptual labels. This is useful for simplifying data and making patterns easier to understand.
3.2.1 Binning
Binning divides the range of an attribute into bins (intervals). There are two main types:
- Equal-Width Binning:
- Divide the range into ( k ) equal-width intervals.
- Example: For the attribute “age” with values [12, 15, 18, 20, 22, 25, 30, 35, 40], create 3 bins:
- Bin 1: [12, 20]
- Bin 2: [21, 30]
- Bin 3: [31, 40]
- Equal-Frequency Binning:
- Divide the range into ( k ) bins, each containing approximately the same number of values.
- Example: For the same “age” values, create 3 bins:
- Bin 1: [12, 15, 18]
- Bin 2: [20, 22, 25]
- Bin 3: [30, 35, 40]
3.2.2 Histogram Analysis
Histograms partition the values of an attribute into disjoint ranges (buckets). The histogram analysis algorithm can be applied recursively to generate a multilevel concept hierarchy.
- Example:
- For the attribute “price” with values [1, 1, 5, 5, 5, 5, 8, 8, 10, 10, 10, 10, 12, 14, 14, 15, 15, 15, 15, 15, 18, 18, 18, 18, 18, 18, 20, 20, 20, 20, 20, 20, 20, 21, 21, 21, 25, 25, 25, 25, 28, 28, 30, 30, 30]:
- Create an equal-width histogram with a bin width of $10:
- Bin 1: [$0, $10]
- Bin 2: [$10, $20]
- Bin 3: [$20, $30]
3.2.3 Cluster, Decision Tree, and Correlation Analyses
- Cluster Analysis:
- Group similar values into clusters and replace raw values with cluster labels.
- Example: Cluster “age” values into “young,” “middle-aged,” and “senior.”
- Decision Tree Analysis:
- Use decision trees to split numeric attributes into intervals based on class labels.
- Example: Split “income” into intervals that best predict “credit risk.”
- Correlation Analysis:
- Use measures like chi-square to merge intervals with similar class distributions.
- Example: Merge adjacent intervals if they have similar distributions of “purchase behavior.”
3.3 Concept Hierarchy Generation for Nominal Data
Concept hierarchies generalize nominal attributes to higher-level concepts (e.g., street → city → country). They can be generated manually or automatically based on the number of distinct values per attribute.
- Example:
- For the attributes “street,” “city,” “province,” and “country”:
- Sort by the number of distinct values:
- Country (15) → Province (365) → City (3567) → Street (674,339).
- Generate the hierarchy:
- Country → Province → City → Street.
- Sort by the number of distinct values:
- For the attributes “street,” “city,” “province,” and “country”:
4. Practical Applications
- Customer Segmentation: Normalize income and age attributes to cluster customers into segments.
- Market Basket Analysis: Discretize purchase amounts into intervals to identify patterns.
- Fraud Detection: Use concept hierarchies to generalize transaction locations (e.g., street → city → country).
5. Conclusion
Data transformation and discretization are essential steps in data preprocessing. They improve data quality, enhance mining efficiency, and facilitate better insights. By normalizing, discretizing, and generating concept hierarchies, you can transform raw data into a form that is ready for analysis.


