Do you want to generate more engagement through your Instagram stories and make sure that your current strategy is working?
You may pour your heart and soul into creating awesome Instagram stories just to find out that they fail to perform as per your expectations. And you know that you can do better.
Instagram stories play a huge role in helping you grab the attention of the intended audience in creative ways. However, to get the optimal results from posting them, you need to know what clicks.
Tracking Instagram story analytics may help. Whether you’re a social media marketer, entrepreneur, or business owner wanting to grow your brand on Instagram, letting the numbers dictate your strategy is a wise move. However, knowing which growth metrics to monitor can be a challenge.
Today, we’re going to discuss Instagram story analytics and tell you about the metrics you should pay attention to. Our goal is to help you understand your audience better, create more engaging content, and grow your brand’s presence on the platform.
Let’s kick things off.
What is Instagram Story Analytics?
Instagram story analytics are the data points that the platform makes accessible to you. They help you track your content’s performance and see how over 2 billion users interact with your stories.
When you access the story analytics, you’ll find data on various metrics. These metrics provide you with relevant insights about your reach, engagement, call to action, and more.
Having access to such data makes it easier for you to understand your audience’s behavior. By looking at the numbers, you can start to see what kind of content resonates with your buyer personas. Plus, you discover the problem areas and the reasons for drop-offs.
Instagram story analytics help you refine your content strategy, make data-driven decisions, and stop wasting your time publishing content that doesn’t get you the desired results.
How to Access Instagram Story Analytics
Now that you know about the significance and benefits of tracking Instagram story analytics, let’s walk you through the process of accessing them. The first thing you need to consider here is that you need to have a professional account to access Instagram insights.
So, if you haven’t already done so, you should upgrade your account to professional for free. After that, all you need to do is follow the given steps:
Step 1: Access the Instagram app through your smartphone. Next, tap on your profile picture in the bottom right corner.
Step 2: Click the menu icon, which is visible as three horizontal lines at the top right corner of your screen.
Step 3: Go to the section ‘For Professionals’ and access ‘Insights.’
Step 4: Explore the section labeled ‘Content You Shared.’
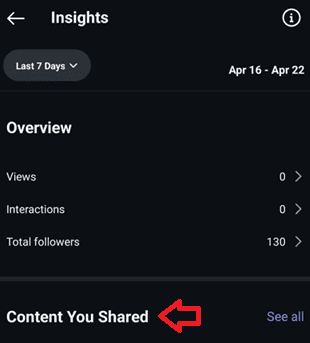
Step 5: Click a particular story to track its performance, or click ‘See All’ to access metrics concerning all stories you shared.
Growth Metrics You Need to Monitor for Instagram Success
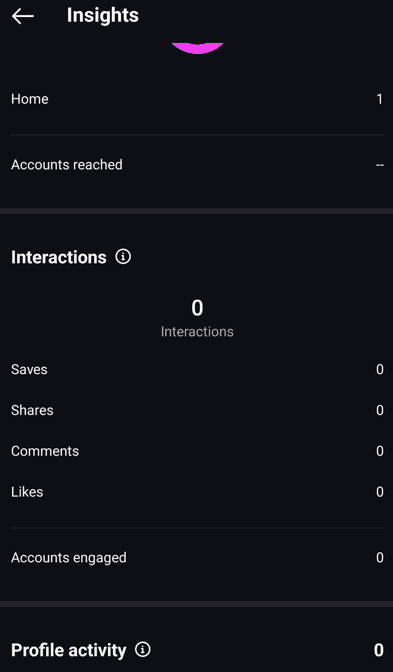
Now that you know how to access Instagram story insights, you must be wondering which metrics you should track to ensure your content’s consistent performance. It all comes down to monitoring data that helps you achieve your goals. We have shortlisted the most important growth metrics that will help you succeed.
Reach
This metric tells you about the number of people who received your message. You know about the number of people you connect with through your content.
Your reach indicates that your content is helping you generate brand awareness and get more eyeballs. It’s the prerequisite for engaging the intended audience through the content you publish.
To succeed, you must monitor your reach over time and across different stories you publish. Your goal is to identify stories that reach more people than others. This helps you understand what kind of content is making it into more viewers’ feeds so that you can stick to that strategy.
Impressions
You shouldn’t confuse this metric with reach. It tells you about the total number of times people viewed your story. Your followers may view your story multiple times, or it can appear more than once in their feeds. Each view counts as an impression. So, tracking impressions is important, as it lets you know if your content is rewatchable.
So, the number representing your impressions will likely be higher than your reach. When people rewatch your content, it indicates that you’re doing a great job of creating it. So, it serves as an excellent motivator.
Taps Forward
This metric tells you about the number of times a viewer tapped to skip to the next story before they finish watching the current one. It’s a no-brainer as to why you should track this metric.
When you see the taps forward graph consistently going upwards, it’s a huge red flag. It indicates your inability to engage the intended audience. Maybe the topics you cover are irrelevant, or the way you create content is too complex to understand.
No matter the reason, you need to revisit your content strategy. The content you publish must be easy to consume, but it shouldn’t be boring.
Taps Back
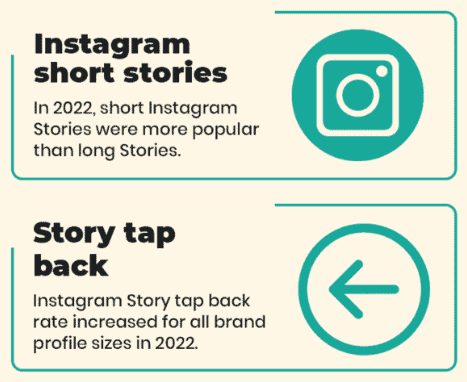
What this metric signifies is the opposite of taps forward. The count of taps back represents the number of times a viewer went back to your Story. So, it goes without saying that it’s a positive sign.
Source
The metric shows your audience’s genuine interest in the content you share. It tells you that you’re doing an excellent job with the content you share through your Instagram account. You’re successful in grabbing the attention of the intended audience and convincing them to keep coming back to you for more.
Exits
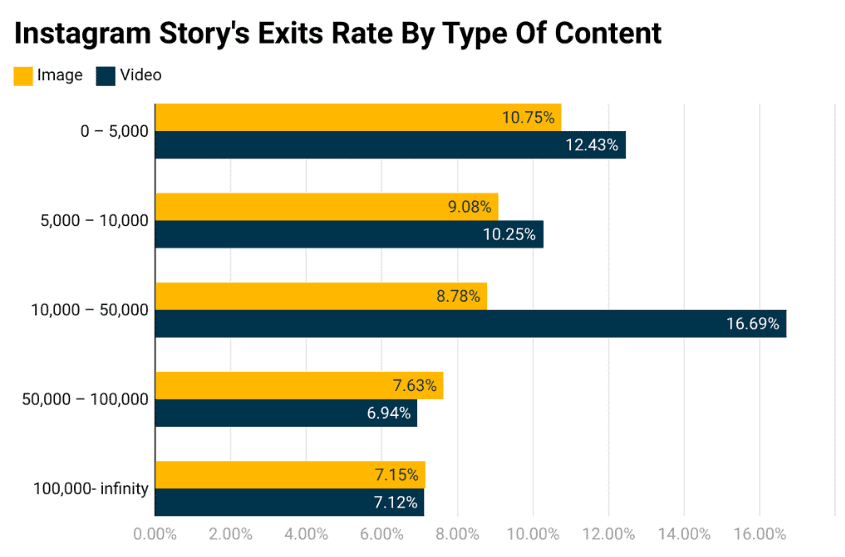
This metric indicates the number of times your audience quits watching your story from a specific frame. They may perform different actions to do so. They exit the story section or close the app altogether.
Source
It strongly indicates that you failed to engage your audience and that you need to reconsider your strategy. The metric also helps you determine where viewers are dropping off. If you record high exit rates on a particular frame, you need to analyze that particular frame or the ones before that to see what went wrong.
Replies
Your ultimate goals of sharing content through social media are to generate awareness about your brand and facilitate audience interactions. So, it goes without saying that tracking the replies to the stories you share is a key engagement metric to track.
When someone replies to your published story, they interact with you directly. The messages they send to you may vary depending on the content you share.
They may simply admire your content, try to get to know you as a brand, or even inquire about the solutions you offer. Keep in mind that 81% of people use Instagram to research products or services they want to buy.
A high number of replies to your stories indicates that your content resonated with the intended audience segments, which led them to initiate a conversation with you. It serves as an opportunity for you to receive audience feedback and improve your content or build a community around your brand.
Shares
This metric indicates your content quality. It tells you that what you publish is share-worthy. Technically, people promote your content for you, so it’s a huge win.
When someone shares your stories with others in their social circle, they endorse your content. It complements your reach. You convey your message to not just those who follow you but also those who likely haven’t even heard about you.
It helps you increase your brand awareness and welcome more interactions. Your organic reach increases, allowing you to engage new and relevant audience segments.
Profile Visits
Another viable growth metric to track is profile visits. It shows you how many people visited your Instagram profile directly after viewing your story. These people can be your followers or the ones who stumbled upon your story through shares.
The metric indicates that your content was engaging enough to make people curious and want to learn more about you. Whether they intend to follow you to keep receiving content updates from you or explore your solutions, it’s a win for you.
Follows
The metric indicates your follower growth. The more follower base you have, the greater your reach by default. Your community is growing, which always indicates that you’re moving toward your goal one step at a time.
Think of it as a level-up to profile visits. These people likely didn’t know that you existed. They decided to join your fan base after viewing your content. It shows how well your stories convert potential viewers into followers.
Link Clicks
This metric tells you how many people tapped on the link embedded in your story to drive off-platform traction. You may use links in your stories to get more website traffic, generate leads, or promote products. So, tracking link clicks enables you to know if your content helps you achieve your goals.
Scoring more link clicks takes more than just sharing engaging content. You have to use a compelling and clear call to action, directing people to tap the link.
Completion Rate
This metric tells you about people who watch your stories to the end. You won’t be able to access this metric directly through Instagram Insights. In fact, there can be many fitting growth metrics that align with your goals, which you may not find in the analytics section.
To track such metrics, you will have to leverage external tools or perform manual calculations. You can get an idea of the completion rate by looking at the reach or impressions of your first frame compared to the last.
To calculate this metric, you need to divide the impressions or views on the last frame by the impressions or views on the last frame and multiply the number by 100.
Some Useful Tips to Consider Before Publishing Stories
We told you about Instagram story analytics and recommended a few noteworthy metrics to track your growth. We also want to share a few useful tips that may help you create engaging stories.
- Introduce yourself in your story in any way you see fit.
- Publish content around topics that align with your niche.
- Make sure that your content is easy to understand.
- Ensure that your message is clear.
- Ensure each frame flows logically into the next.
- Build a narrative that keeps viewers engaged from start to finish.
- Leverage humor, the element of surprise, or the fear of missing out.
- Use a clear and compelling call to action.
- Avoid plugging in important information only at the very end, in case people drop off.
- Use relevant hashtags and location tags when sharing your stories, as they improve your content’s discoverability.
- Encourage audience interaction by asking for likes, replies, shares, or follows.
- If you use links, make sure that the page you link to is mobile-friendly and loads quickly.
- Post consistently to let your audience know when to expect your content.
Start Tracking to Ensure Your Growth
We told you about the importance of monitoring Instagram story analytics and how it can help you achieve success on the platform. Tracking every possible growth metric can be overwhelming. So, we recommended a list of indicators that you must monitor by any means.
You can’t rely on guesswork if you’re serious about growing your brand on Instagram. You need access to real data to see what’s working and what’s not. It’s a sure-shot way to produce engaging content and achieve your goals through it consistently.
Each metric that we discussed reveals something distinct about your content and your audience. To put this knowledge into action, start by monitoring the performance of your recent Stories. Experiment with different types of content, watch how your audience reacts, and use the data to make smart choices moving forward.
We understand that consistently sharing relevant content and tracking its performance can be tiresome. To make things easy, you can consider leveraging one-stop content sharing and automation tools like Bulk.ly with advanced analytics capabilities.
You can streamline your publishing schedule and track all important metrics through a single screen. You can effortlessly access deeper insights into your content performance and grow your Instagram presence.


