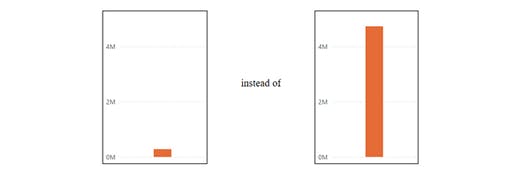
Long story short, once I found that a report I had previously created showed strange data. I can’t show you real visuals as they contain data I can’t disclose, so they are just blank in the article or are mocked. Please, imagine you are expecting to see a few hundred thousand but seeing only hundreds.
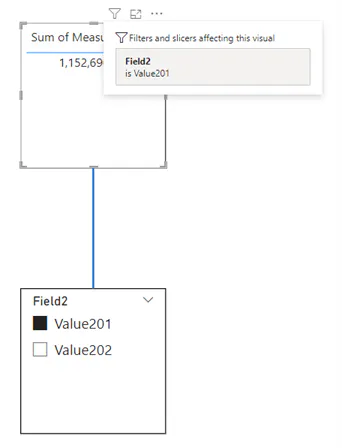
All visible slicers were not set up, but the numbers were too low. Thankfully, the Filters feature helps us understand what filters are applied to the visual:


The second filter is legitimate, so there is no problem there. But another one showed one value of the “National name” field. This filtration was applied to all visuals on the page. The is such a slicer on the page, however, it was not set up (it showed All), and the Filters pane showed this filter — so slicers have nothing to do with it. To prove this point, I removed all visuals from the list except the table — the filter was still applied.


All suggestions I found while surfing the internet led to checking hidden slicers, which I had already done. It seems to me like a bug or glitch, which appeared somehow while I was editing other pages and the data model.
One option is to rebuild the whole page from scratch or at least copy and paste all visuals onto a new page and set them up. However, there were many tricky interaction relationships between them, and this approach would require manual setup and is time-consuming. It would be a problem since there were four dozen visuals, and recreating the correct relationships would be a nightmare. Roughly 1500 clicks would be needed to change the size of visuals and their locations to be able to click on an interaction icon, and then return everything to its place. No, thanks. If there’s a chance to avoid that, I’ll take it.
Attempts to delete or rename either the value or field did not help.
So the only way left is to edit the internal files of the report.
Editing Internal Files of the Report
Well, here we come to the main point of the article. There are two parts. The first part will tell you how to get to internal files and a few things about their structure, if you never edit them probably you should read it first. The second part will provide the final short solution that worked well for me, so if you have some experience you can just jump to it.
I suggest making a copy of your report to work with in case something goes wrong. If you work in the standard Windows Explorer, you might need to turn on “Show file extensions” in its settings.


Rename the file, changing .pbix to .zip, and agree with the warning.


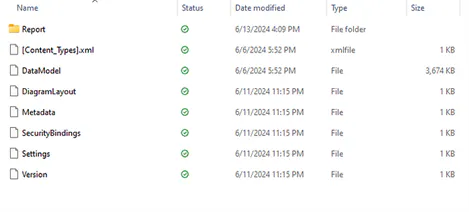
Extract the files and go to the resulting folder.


Here you can see the files in which Power BI stores all report data. For an explanation of these files, refer to this article.

The file we are looking for is in the Report folder and is called Layout. You can use any app you prefer to navigate and edit it. Standard MS Notepad lacks advanced features, so I prefer Notepad++ for editing text files. It has syntax highlighting and different plugins. For working with JSON, I used JSONTools. If you know exactly what and where to edit, you might use just Notepad, but for the first time, it makes sense to use advanced tools.
As mentioned previously, the Layout file stores data in JSON format. If you need to become more familiar with JSON, I suggest you take a pause here and learn a bit about it: JSON on Wikipedia, W3Schools JSON Tutorial, and MDN Web Docs on JSON.


This is how it looks in plain text view. To improve readability, use the “Pretty-print current JSON file” function of the JSONTools plugin.


If your file is well-structured but lacks syntax highlighting, you can add it by selecting Language -> JSON.


Now it looks clearer, however, some of the values contain strings of JSON, so instead of a full tree, we see only one block.


To see all data in a tree view, replace some symbols. Warning! The following actions will break the initial structure of the file and make it unusable for reassembling the Power BI report. Use this only for learning and investigation.
Replace:
- “{ with {
- }” with }
- “[ with [
- ]” with ]
- ” with “
It might be helpful to create a Macro in Notepad++ and save these actions for future use.
After replacing, use the “Pretty-print current JSON file” of the JSONTools plugin again.


Now it looks much better, and we can use it for exploration. For easier navigation, you can open the JSON Tree viewer from the JSONTools plugin. It looks similar to the Notepad view but shows the number of values for each key and data type.


Now we can go deeper into the structure of the Layout file.


The clause here is exactly what we have in the test report:

If a visual has a filter set up through the Filter pane, we find the clause in the Filters value as well:


This is some theory obtained from parsing the Layout file of a simple test report. It’s time to look at the Layout from the broken live report. Open the file, transform it for better exploration, and find the required filter in the data query block. Also, there is a non-empty Filter block, which filters by another field, so it’s valid.


Removing Filtering
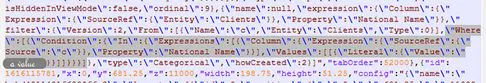
Now we understand the structure of the file and I can try to look at the initial untransformed file. The only way to find the places we are looking for is to search by names used in the report. Fortunately, we have the value of the problematic field. There were 3 dozen such places in the file. Here you can see the selected part of the Where clause with the problematic condition:


Now we can delete the Condition section (in all clauses where they are met), or delete the whole Where section if there is only one condition. Notepad++ helps you to identify beginning and end brackets with highlights.

After deleting, save the file. If you made a copy, move it to another folder — there should be only one Layout file in the Report folder.
Now, there’s one last step which took me a lot of hours — if you skip it, your pbix report won’t open even if you made no mistakes editing the Layout file.
You should delete the SecurityBindings file from the root folder of the report.
According to the article mentioned earlier, this file contains Row-Level Security data. Keeping it before reassembling the report will prevent it from opening. Since I have no RLS in this report, it’s not a problem to delete it. At least, I haven’t found any issues in the report after doing so.


Delete the SecurityBindings file and zip the report folder: select all files and folders, and send them to a Compressed (zipped) folder. Then change the extension back to .pbix and try to open it. If done correctly, your file will successfully open with Power BI Desktop, and you will find your report is fixed.


Error after editing the Layout file
If you get an error while opening the report, you might have made a mistake editing the files. Try to repeat all steps from scratch. You can make small changes step-by-step and check if there are errors after each step.


