
This article is based on my own experience deploying stablecoins across various DeFi lending markets.
Over time, I noticed that headline APYs are often misleading unless you clearly understand what actually drives them.
Here, I focus on simple lending markets and introduce a practical framework I personally use when evaluating where to deploy stablecoin liquidity. In subsequent articles, I plan to cover:
- yield-bearing stablecoins,
- working with principal tokens (using Pendle Finance as an example),
- AMM pools,
- and looping strategies.
The goal of this piece is not to rank protocols or promote specific opportunities, but to share a risk-aware mental model for evaluating stablecoin lending markets
1. A Practical Evaluation Framework
When analyzing a potential lending pool, I typically look at the following dimensions:
- Supply cap
- Liquidity pool size (TVL)
- Borrow cap and utilization rate
- Source of yield
- Exposure and curators
- Incentives reality check
Before deploying capital, it is worth defining which platforms you are comfortable using in day-to-day practice. In DeFi, new protocols appear constantly, often advertising very high APYs. The primary risks usually stem from smart contract complexity, limited operating history, or insufficient audits.
For this reason, I deliberately limit my own activity to a conservative set of well-established protocols, such as:
- Aave
- Fluid
- Morpho
- Compound Finance
- Kamino
2. Check the Supply Cap
I always start by checking the supply cap. It is one of the fastest ways to understand whether a pool is offering genuine protocol yield or is primarily driven by temporary incentives.
In the example of RLUSD on Aave, the supply cap has already been fully reached, meaning that no additional deposits are currently possible.
Supply caps are commonly used in markets where yield is supported by incentives. By limiting the amount of supplied liquidity, protocols can maintain an attractive headline APY within a fixed rewards budget. This makes such yield inherently scarce — and therefore temporary.
In the RLUSD example:
-
the base protocol yield is approximately 1.2% APY,
-
while incentives contribute an additional 5.12% APY, accounting for the majority of total returns.
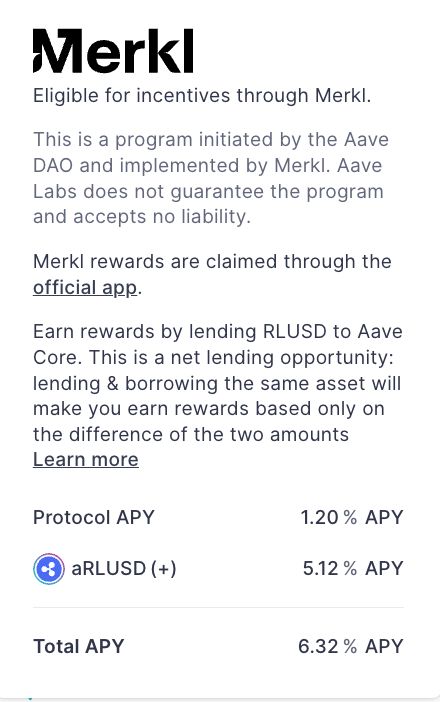
At this point, it is important to recognize that you are farming a reward program, not protocol yield. Once incentives are exhausted, the risk–return profile deteriorates sharply and the strategy often loses its appeal.
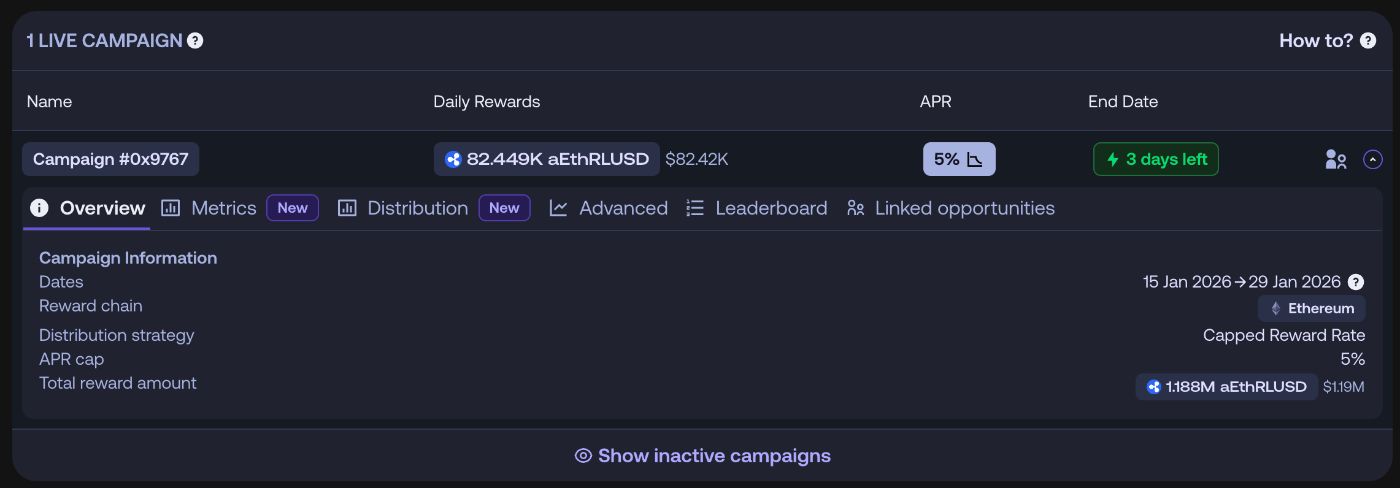
Before entering any incentive-driven market, I always verify that:
- rewards are still available, and
- they are expected to last for a meaningful period of time.
For incentive programs distributed via Merkl, this can usually be checked directly in the pool details.
3. Liquidity Pool Size (TVL)
The size of the liquidity pool plays a critical role in APY sustainability.
Smaller pools are far more sensitive to new inflows of capital. Even a seemingly attractive 10% APY can compress quickly once additional liquidity is supplied.
In my experience, pools with a TVL of $8 million or more tend to offer more stable and predictable returns. If the TVL is significantly smaller, I make sure that my position size is at least 50× smaller than the total pool size. This helps minimize my own impact on utilization and yield dilution.
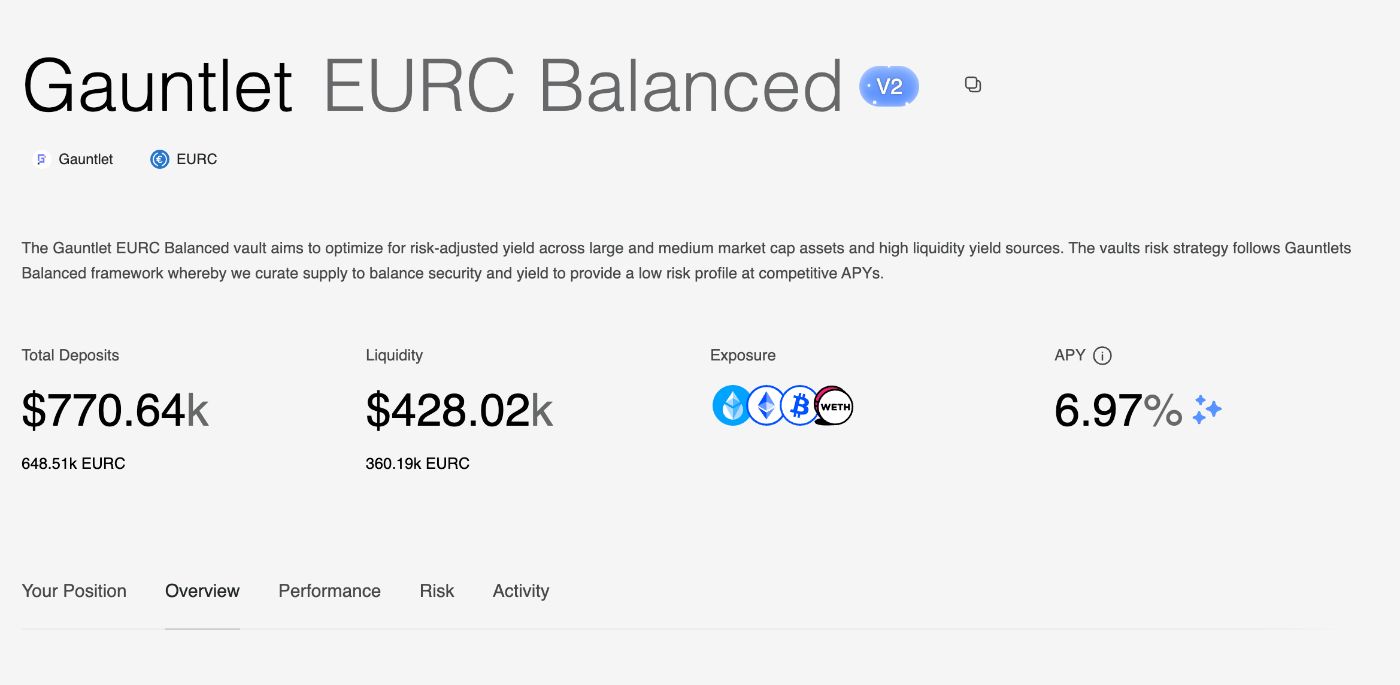
In the example below:
- TVL: $428k
- APY: 6.97%
At this scale, even modest increases in supplied liquidity — especially in the absence of incentives — are likely to result in a noticeable drop in APY.
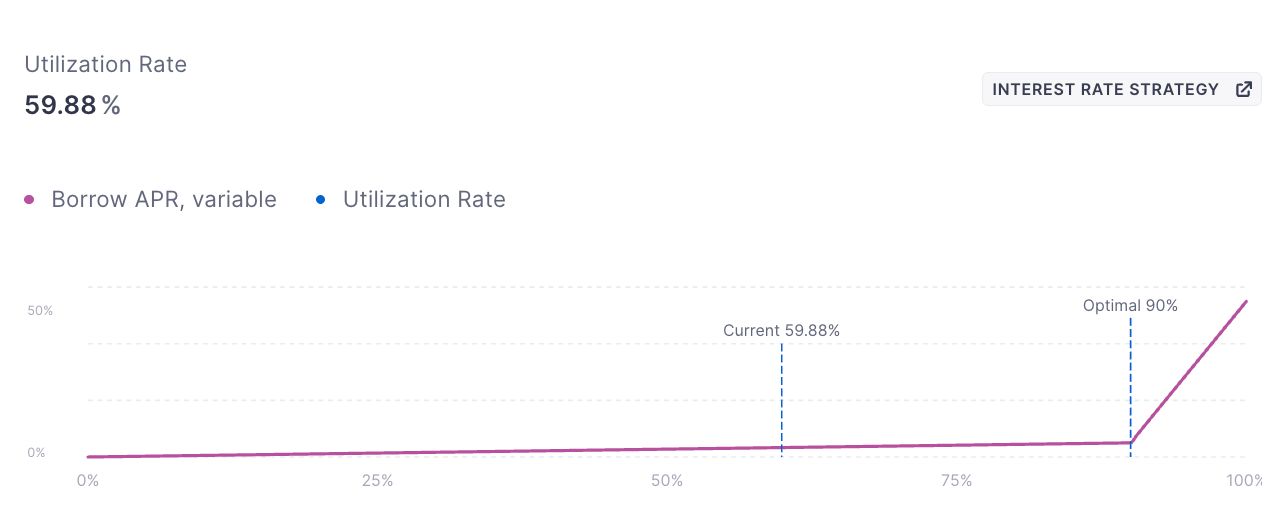
4. Borrow Cap and Utilization Rate
Another key parameter is the borrow cap and the resulting utilization rate (UR), defined as:
UR = Borrowed / Supplied
As utilization increases, lending APY rises because borrowers are competing for a limited amount of available liquidity. However, this effect is usually temporary rather than structural.
If additional liquidity enters the pool, utilization declines and APY adjusts downward accordingly.
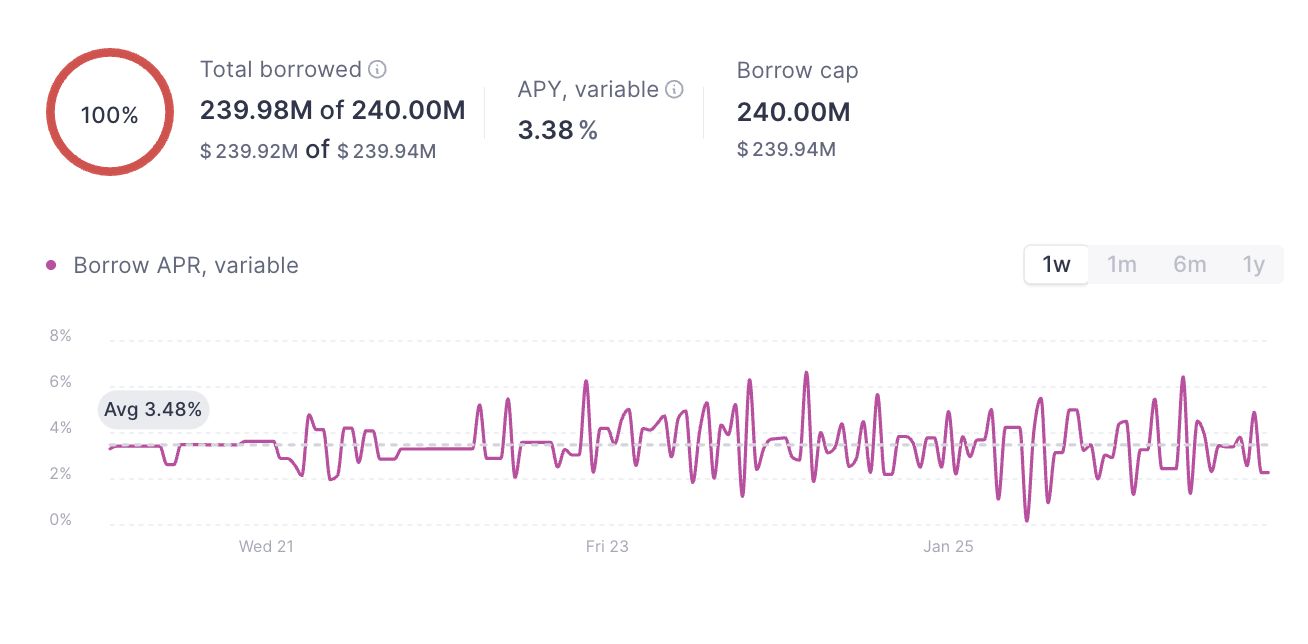
In the example:
- no significant new supply inflows are expected, and
- the borrow cap has already been reached, limiting further borrowing.
This configuration can support elevated utilization and yield — but typically only for a limited period of time.
In most lending markets, a utilization range of 70–80% is considered healthy. Above this level, systems tend to self-regulate:
- higher utilization → higher APY
- higher APY → attracts new suppliers
- increased supply → lower utilization
- lower utilization → declining APY
For this reason, entering a pool at utilization levels above 80% is often a poor risk-adjusted entry point. There is a high probability that APY will compress shortly after entry as the market rebalances.
5. Source of Yield
In practice, understanding why a pool is offering elevated APY matters far more than the headline number itself. In practice, lending market yield tends to fall into one of three categories.
5.1 Borrow-Driven Yield
This type of yield is supported by genuine borrowing demand. Typical drivers include:
- arbitrage,
- hedging activity,
- leverage.
Borrow-driven yield is generally the most sustainable, as it reflects real economic demand rather than external subsidies.
5.2 Incentive-Driven Yield
Here, yield is primarily the result of protocol subsidies rather than organic demand. Common examples include:
- token emissions,
- liquidity mining programs,
- temporary yield boosts.
This form of yield is inherently temporary and should always be evaluated together with:
- reward budgets,
- emission schedules,
- and expected program duration.
5.3 Structural Imbalances
In some cases, elevated yield arises from temporary structural inefficiencies, such as:
- short-term liquidity shortages,
- uneven TVL distribution across markets,
- newly launched pools or trading pairs.
While these situations can offer attractive short-term opportunities, they usually normalize quickly as liquidity reallocates.
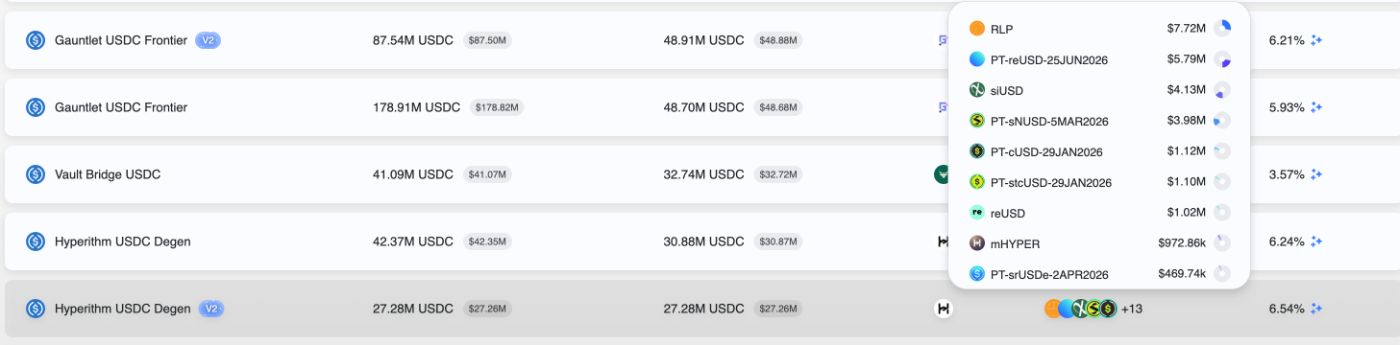
6. Exposure and Curators
This dimension becomes especially important in protocols such as Morpho or Euler, where risk is influenced not only by market dynamics but also by curator decisions.
Always analyze which assets your stablecoins can be borrowed against. If the allowed collateral set carries elevated risk, sharp price movements or depegs can lead to the formation of bad debt.
In such scenarios, lenders may be unable to withdraw their stablecoins in full — or may only recover a portion of their supplied liquidity.
This risk is particularly relevant in:
- curator-managed vaults,
- markets with aggressive collateral whitelists,
- or pools optimized for higher APY at the expense of conservative risk parameters.
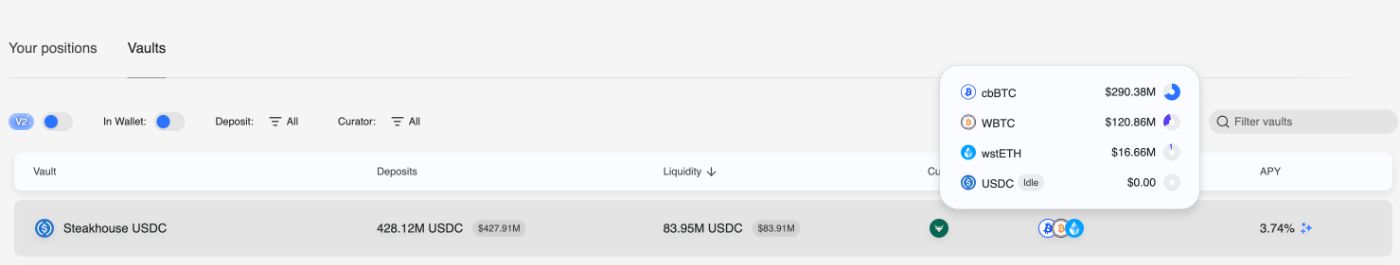
The examples below illustrate the difference between a higher-yield pool with meaningful collateral risk and a more conservative alternative with lower but more resilient returns.
Alternatively, this pool offers a much more conservative exposure:
7. Incentives Reality Check
If a portion of the yield is paid in protocol-native tokens, liquidity and exit conditions must be evaluated carefully.
Yield that cannot be realized without significant price impact should not be considered sustainable.
In the example below, converting incentive rewards back into stablecoins would result in an estimated −2.88% loss due to slippage. In practice, this means that the headline APY materially overstates the realizable return.
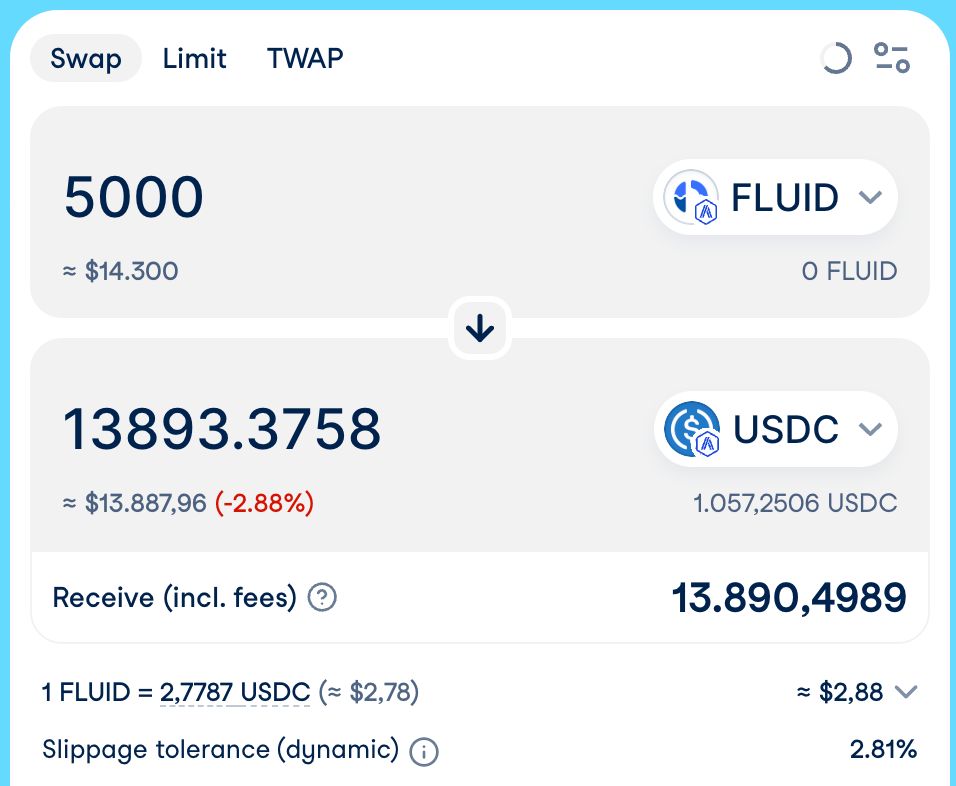
One way to reduce price impact is to claim and sell rewards more frequently, for example on a daily basis. However, transaction fees must also be taken into account and will depend on the chain where rewards are distributed.
8. Final Thoughts
Stablecoin lending is often perceived as “low risk” and “set and forget”. In practice, most underperformance comes from incentive decay, yield dilution, or poorly understood exposure.
A simple framework like this will not eliminate risk, but it helps avoid the most common — and expensive — mistakes.
Best regards and profitable yields,
SENTRA


