By using this site, you agree to the Privacy Policy and Terms of Use.
Accept
World of SoftwareWorld of SoftwareWorld of Software
  • News
  • Software
  • Mobile
  • Computing
  • Gaming
  • Videos
  • More
    • Gadget
    • Web Stories
    • Trending
    • Press Release
Search
  • Privacy
  • Terms
  • Advertise
  • Contact
Copyright © All Rights Reserved. World of Software.
Reading: Medical AI Models Battle It Out—And the Winner Might Surprise You | HackerNoon
Share
Sign In
Notification Show More
Font ResizerAa
World of SoftwareWorld of Software
Font ResizerAa
  • Software
  • Mobile
  • Computing
  • Gadget
  • Gaming
  • Videos
Search
  • News
  • Software
  • Mobile
  • Computing
  • Gaming
  • Videos
  • More
    • Gadget
    • Web Stories
    • Trending
    • Press Release
Have an existing account? Sign In
Follow US
  • Privacy
  • Terms
  • Advertise
  • Contact
Copyright © All Rights Reserved. World of Software.
World of Software > Computing > Medical AI Models Battle It Out—And the Winner Might Surprise You | HackerNoon
Computing

Medical AI Models Battle It Out—And the Winner Might Surprise You | HackerNoon

News Room
Last updated: 2025/08/28 at 8:05 AM
News Room Published 28 August 2025
Share
SHARE

Table of Links

Abstract and 1. Introduction

  1. Materials and Methods

    2.1 Vector Database and Indexing

    2.2 Feature Extractors

    2.3 Dataset and Pre-processing

    2.4 Search and Retrieval

    2.5 Re-ranking retrieval and evaluation

  2. Evaluation and 3.1 Search and Retrieval

    3.2 Re-ranking

  3. Discussion

    4.1 Dataset and 4.2 Re-ranking

    4.3 Embeddings

    4.4 Volume-based, Region-based and Localized Retrieval and 4.5 Localization-ratio

  4. Conclusion, Acknowledgement, and References

3 Evaluation

In this section, we evaluate the retrieval recall of the methods explained in Section 2.4 and Section 2.5. The results related to the 29 coarse anatomical structures from Table 1 and the results related to the original 104 fine-grained anatomical structures from Wasserthal et al. [2023] are presented separately in the following. In the tables presented in this section, the average and standard deviation (STD) columns allow identifying difficult classes across models (low average) and the ones that have higher variations among models (higher STD). The average and STD rows show the average and STD over all the classes for each model.

3.1 Search and Retrieval

3.1.1 Slice-wise

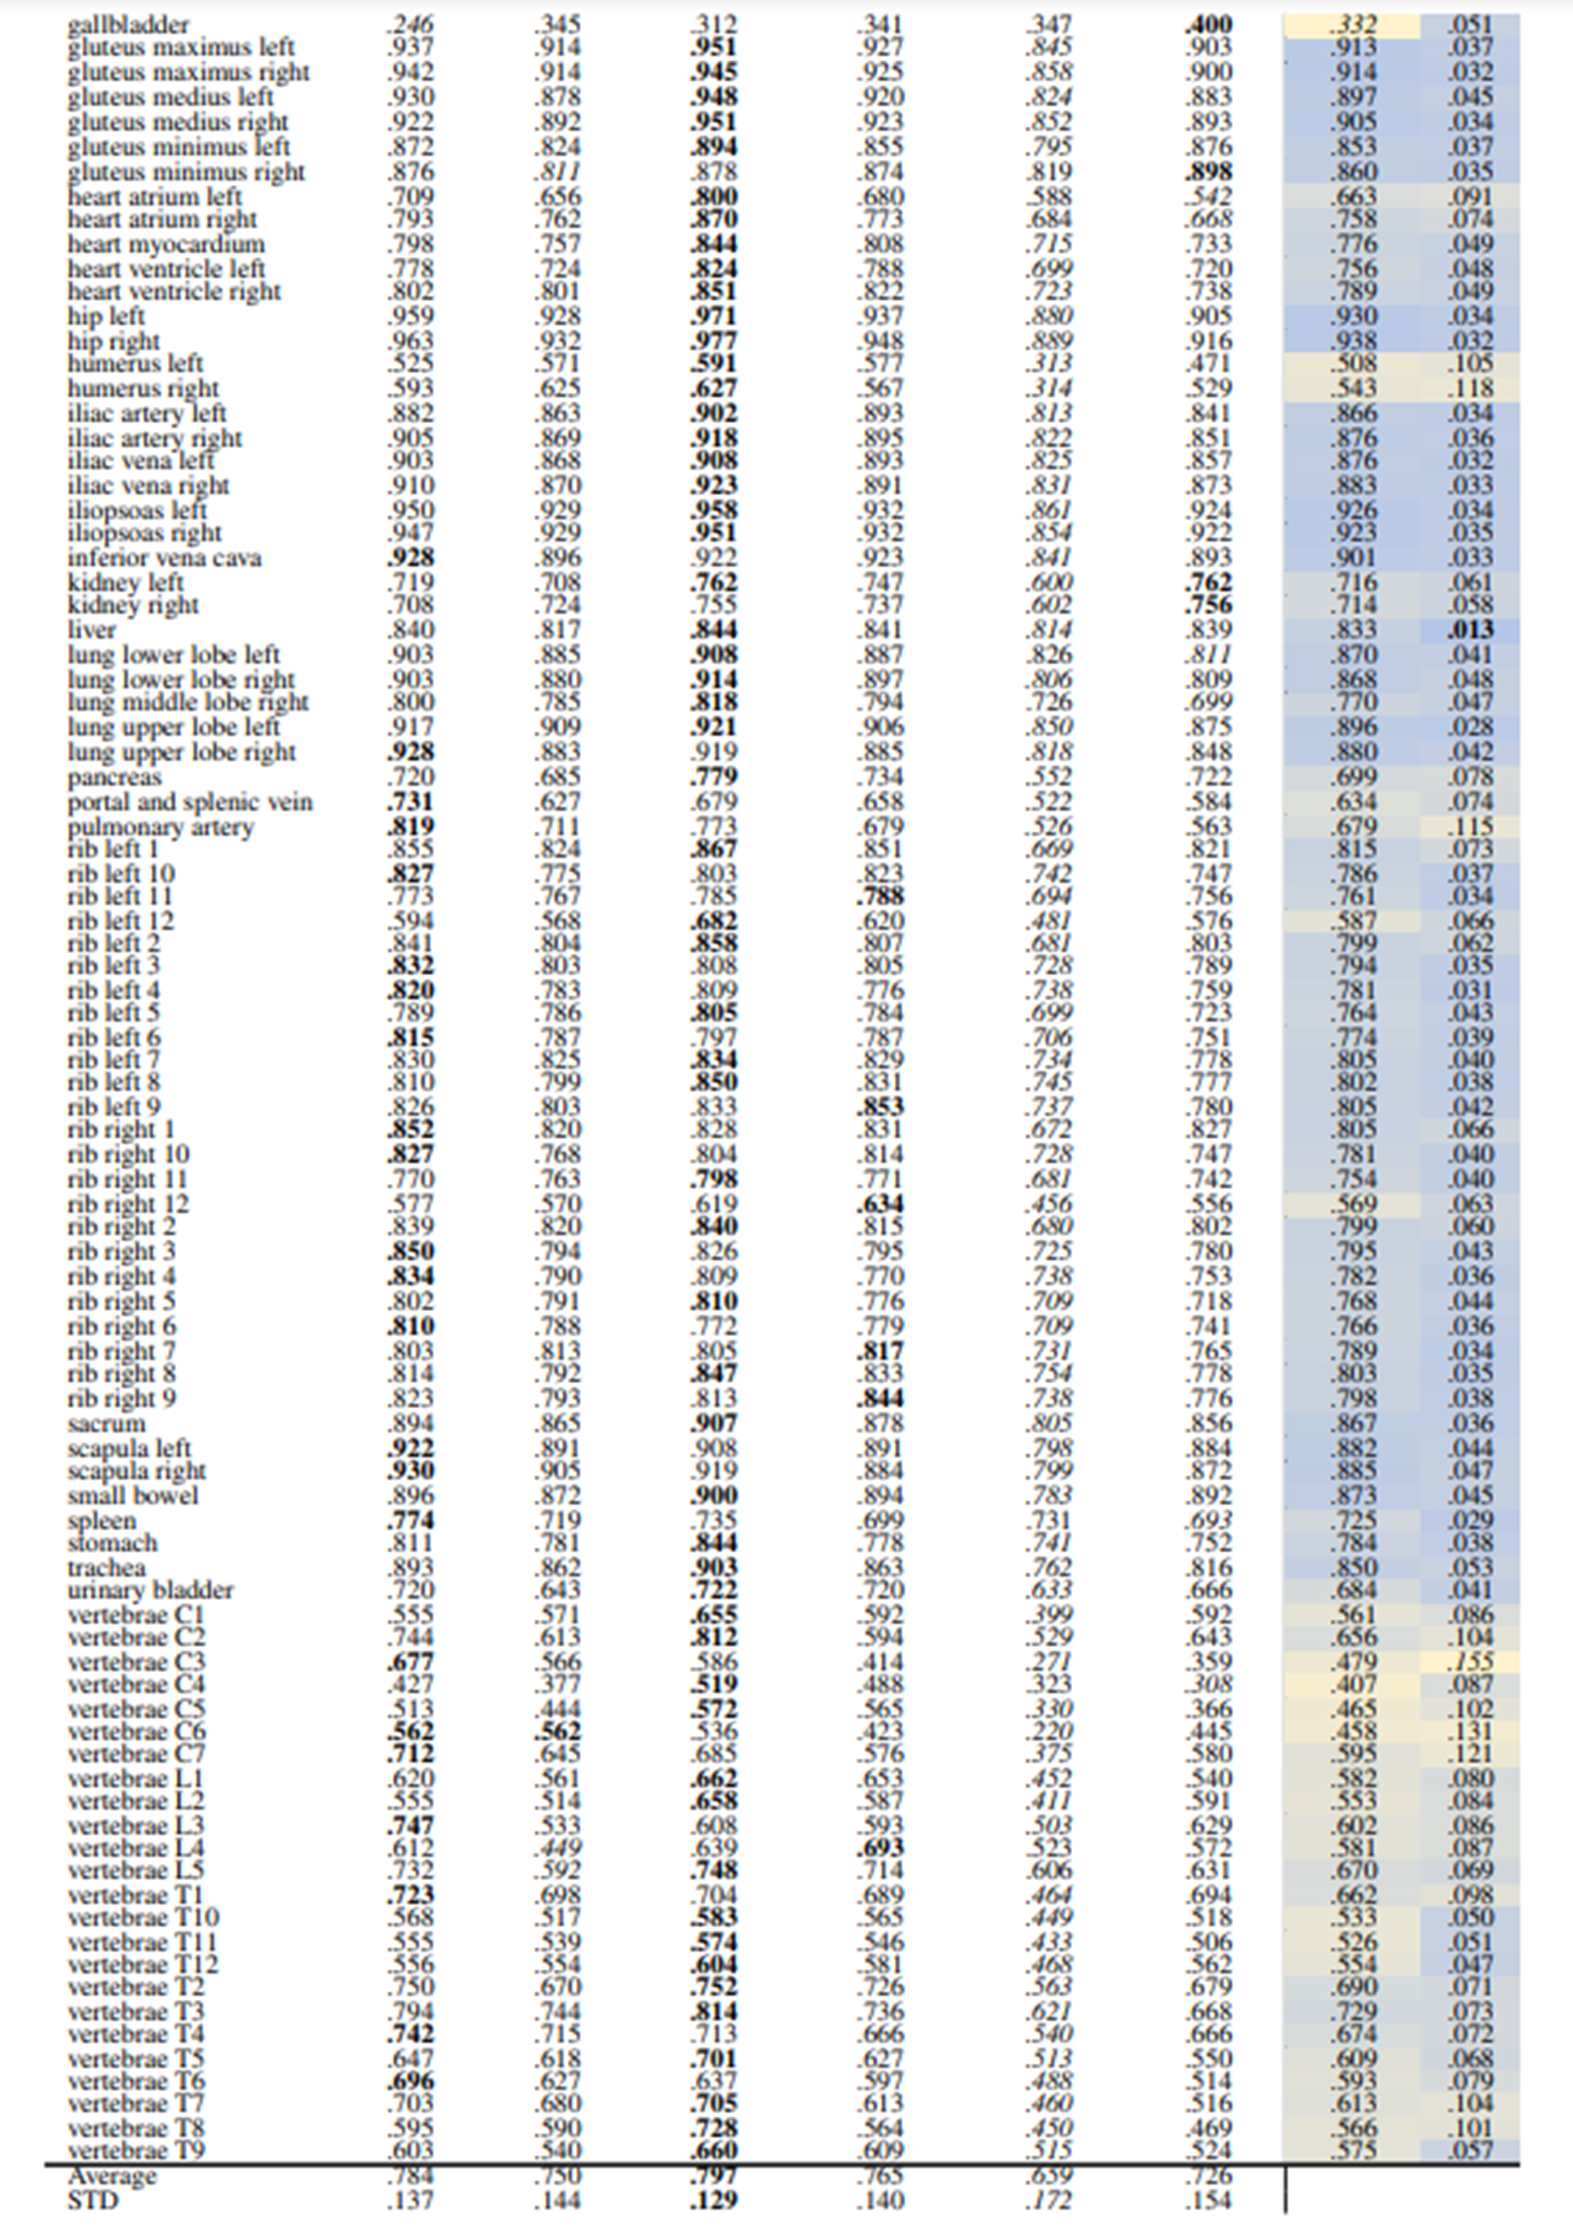
Detailed computation of the recall measure for different retrieval methods is explained in Section 2.4. Table 2 and Table 3 show the retrieval recall of 29 coarse anatomical regions and 104 original TS anatomical regions, respectively, using the slice-wise method. The slice-wise recall is considered the lower bound recall because for a perfect recall all the anatomical regions present in the query slice should appear in the retrieved slice.

In slice-wise retrieval, DreamSim is the best-performing model with retrieval recall of .863 ± .107 and .797 ± .129 for coarse and original TS classes, respectively. ResNet50 pre-trained on fractal images has the lowest retrieval recall almost on every anatomical region for 29 and 104 classes. This is however expected due to the nature of synthetic generated images.

In Table 3 the gallbladder has the lowest retrieval rate followed by vertebrae C4 and C5 (see average column). However, in Table 2 the vertebrae class shows a higher recall which indicated that the vertebrae classes were detected but the exact location, i.e. C4 or C5 were mismatched. The same pattern can be observed in rib classes.

Continue with the next figure

Table 3: Slice-wise recall of all TS anatomical regions (104 classes) using HNSW Indexing. In each row, bold numbers represent the best-performing values, while italicized numbers indicate the worst-performing. The separate average and standard deviation (STD) columns are color-coded, with blue indicating the best-performing values and yellow indicating the worst-performing values across different models. Additionally, bold numbers in colored columns represent the best classes in terms of average and standard deviation, while italicized values represent the worst-performing class across the models.

3.1.2 Volume-based

This section presents the recall of volume-based retrieval explained in Section 2.4.1 An overview of the evaluation is shown in Figure 2. In volume-based retrieval, per each query volume, one volume is retrieved. In the recall computation, the classes present in both the query and the retrieved volume are considered TP classes. The classes that are present in the query volume and are missing from the retrieved volume are considered FN.

Table 4 and Table 5 present the retrieval recall of the volume-based method on 29 and 104 classes, respectively. The overall recall rates are increased compared to slice-wise retrieval which is expected due to the aggregation and contextual effects of neighboring slices.

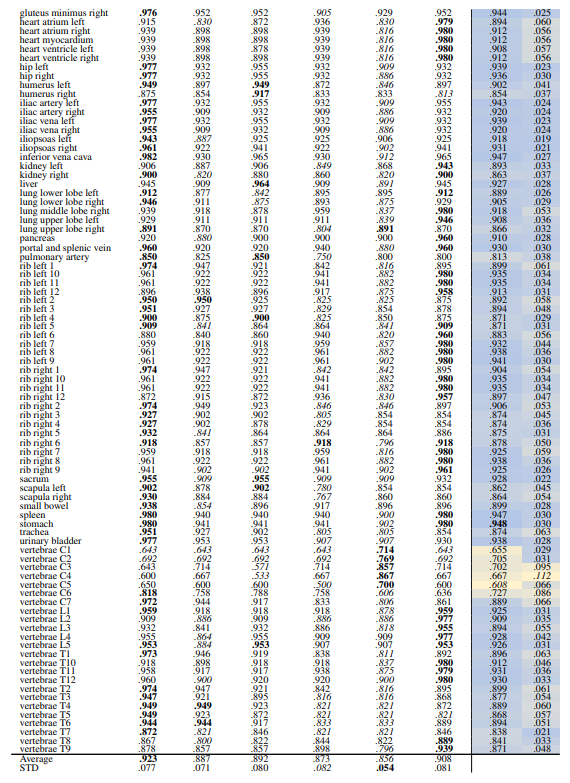
Table 4 shows that ResNet50 trained on RadImageNet outperforms other methods with an average recall of .952 ± .043. However, in Table 5 DINOv1 outperforms all models including ResNet50 with an average recall of .923 ± .077. This shows that the embeddings of finer classes are retrieved and assigned to a different similar class by ResNet50, thus, the performance from fine to coarse classes is improved. Whereas, all the self-supervised methods in Table 5 outperform the supervised methods. Although some models perform slightly better than others based on looking at isolated classes, overall models perform on par.
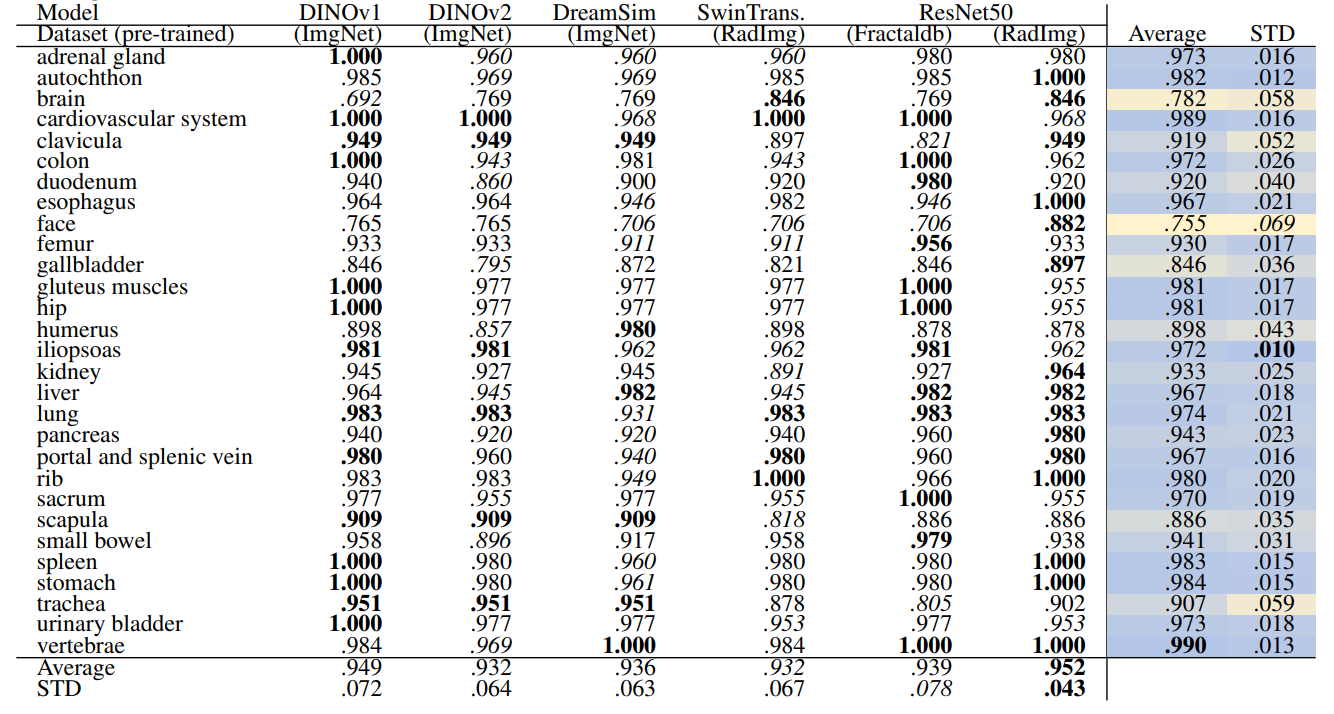
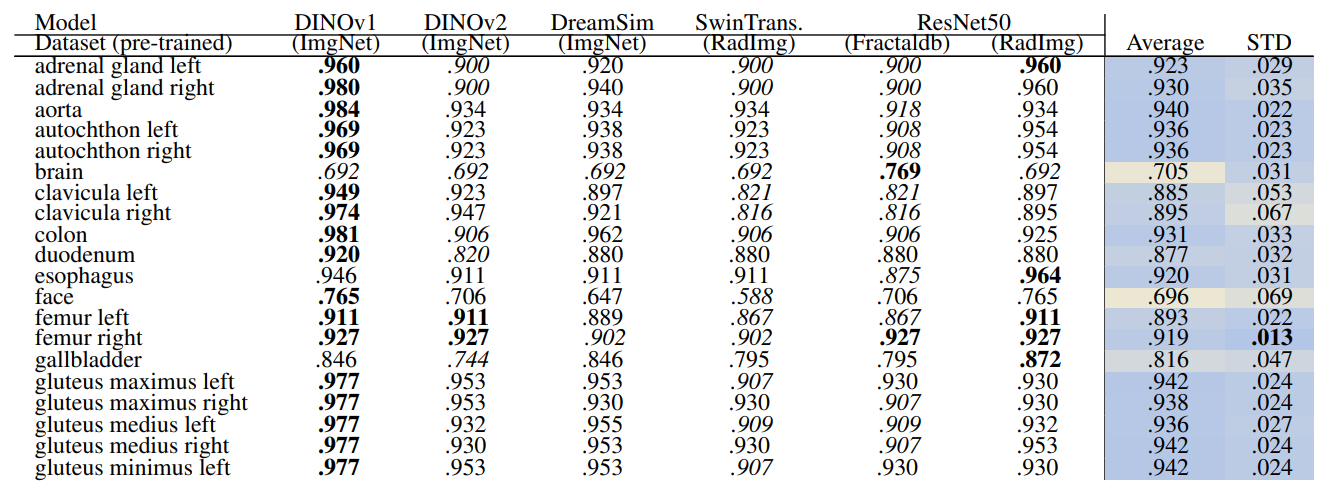
Table 4: Volume-based retrieval recall of coarse anatomical regions (29 classes) using HNSW Indexing. In each row, bold numbers represent the best-performing values, while italicized numbers indicate the worst-performing. The separate average and standard deviation (STD) columns are color-coded, with blue indicating the best-performing values and yellow indicating the worst-performing values across different models. Additionally, bold numbers in colored columns represent the best classes in terms of average and standard deviation, while italicized values represent the worst-performing class across the models.

Continue with the next figure

Table 5: Volume-based retrieval recall of all TS anatomical regions (104 classes) using HNSW Indexing. In each row, bold numbers represent the best-performing values, while italicized numbers indicate the worst-performing. The separate average and standard deviation (STD) columns are color-coded, with blue indicating the best-performing values and yellow indicating the worst-performing values across different models. Additionally, bold numbers in colored columns represent the best classes in terms of average and standard deviation, while italicized values represent the worst-performing class across the models.

3.1.3 Region-based

This section presents the recall of region-based retrieval. An overview of the evaluation is shown in Figure 3. In regionbased retrieval, per each anatomical region in the query volume, one volume is retrieved. In the recall computation, the classes present in both the sub-volume of the query and the corresponding retrieved volume are considered TP classes. The classes that are present in the query sub-volume and are missing from the retrieved volume are considered FN.

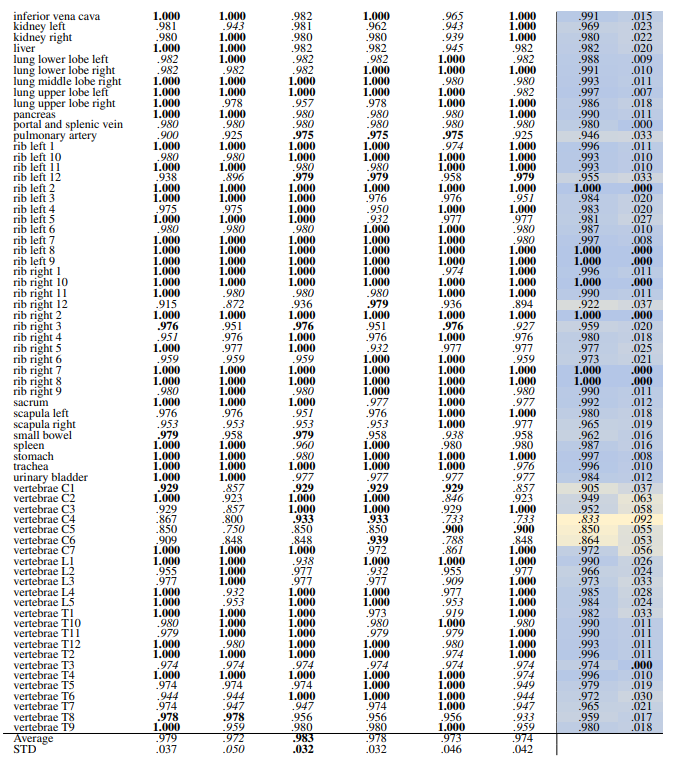
Table 6 and Table 7 present the retrieval recalls. Compared to volume-based retrieval the average retrieval for the regions is higher. The performance of the models is very close. DreamSim performs slightly better with an average recall of .979 ± .037 for coarse anatomical regions and .983 ± .032 for 104 anatomical regions. The retrieval recall for many classes is 1.0. The standard deviation among classes and the models is low, with the highest standard deviation of .076 and .092, for coarse and fine classes respectively.
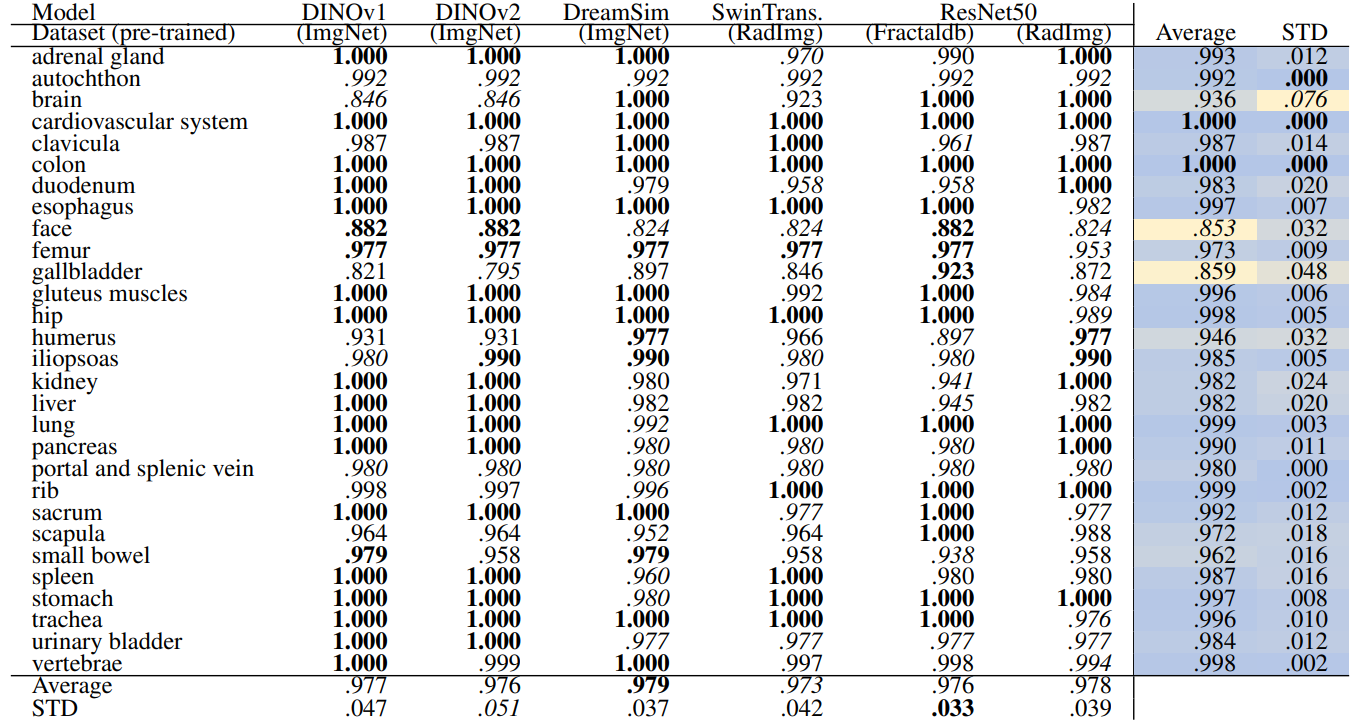
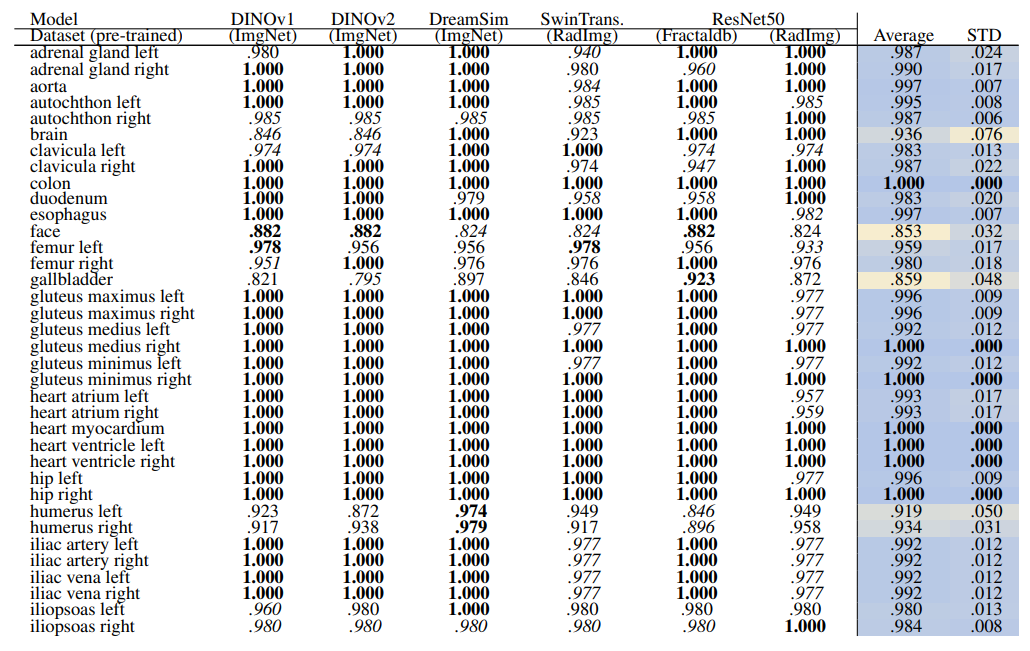
Table 6: Region-based retrieval recall of coarse anatomical regions (29 classes) using HNSW Indexing. In each row, bold numbers represent the best-performing values, while italicized numbers indicate the worst-performing. The separate average and standard deviation (STD) columns are color-coded, with blue indicating the best-performing values and yellow indicating the worst-performing values across different models. Additionally, bold numbers in colored columns represent the best classes in terms of average and standard deviation, while italicized values represent the worst-performing class across the models.

Continue with the next figure

Table 7: Regiond-based retrieval recall of all TS anatomical regions (104 classes) using HNSW Indexing. In each row, bold numbers represent the best-performing values, while italicized numbers indicate the worst-performing. The separate average and standard deviation (STD) columns are color-coded, with blue indicating the best-performing values and yellow indicating the worst-performing values across different models. Additionally, bold numbers in colored columns represent the best classes in terms of average and standard deviation, while italicized values represent the worst-performing class across the models.

3.1.4 Localized

This section presents the recall and localization-ratio of localized retrieval. An overview of the evaluation is shown in Figure 4. In localized retrieval, per each anatomical region in the query volume, one volume is retrieved.

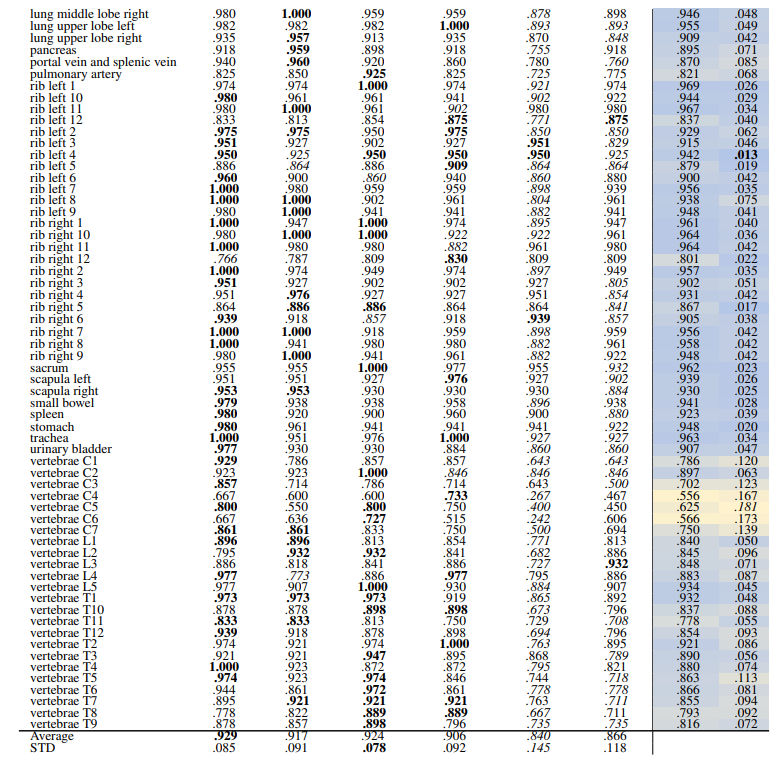
Localized Retrieval Recall The recall calculation for localized retrieval is explained in Section 2.4.3 and an overview is shown in Figure 4. Table 8 and Table 9 present the retrieval recalls. Compared to region-based retrieval the average retrieval for regions is lower which is expected based on the more strict metric defined. The performance of models is close, especially the self-supervised models. DINOv2 performs best for 29 anatomical regions with an average recall of .941 ± .077. For 104 regions the performance of models is even closer with DINOv1 performing slightly better with an average recall of .929 ± .085.
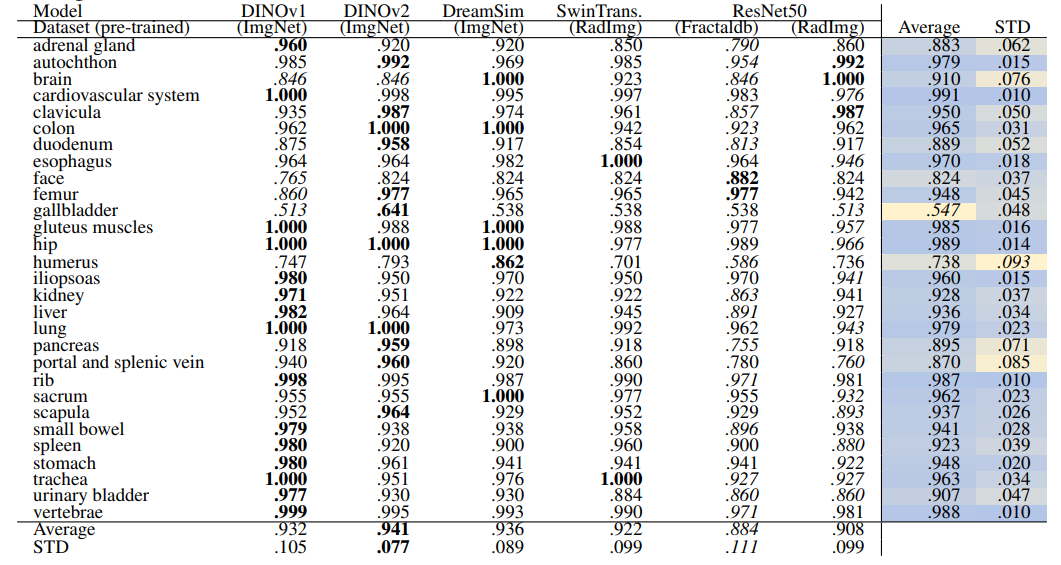
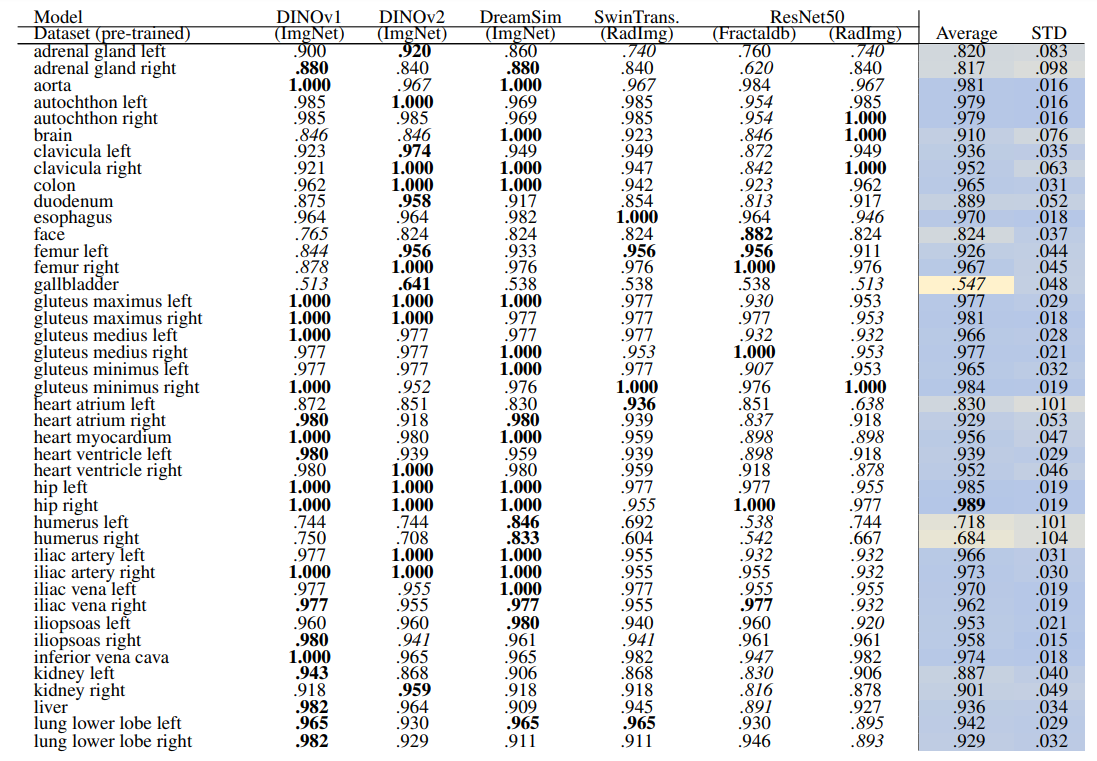
Table 8: Localized retrieval recall of coarse anatomical regions (29 classes) using HNSW Indexing, L = 15. In each row, bold numbers represent the best-performing values, while italicized numbers indicate the worst-performing. The separate average and standard deviation (STD) columns are color-coded, with blue indicating the best-performing values and yellow indicating the worst-performing values across different models. Additionally, bold numbers in colored columns represent the best classes in terms of average and standard deviation, while italicized values represent the worst-performing class across the models.

Continue with the next figure

Table 9: Localized retrieval recall of all TS anatomical regions (104 classes) using HNSW Indexing, L = 15. In each row, bold numbers represent the best-performing values, while italicized numbers indicate the worst-performing. The separate average and standard deviation (STD) columns are color-coded, with blue indicating the best-performing values and yellow indicating the worst-performing values across different models. Additionally, bold numbers in colored columns represent the best classes in terms of average and standard deviation, while italicized values represent the worst-performing class across the models.

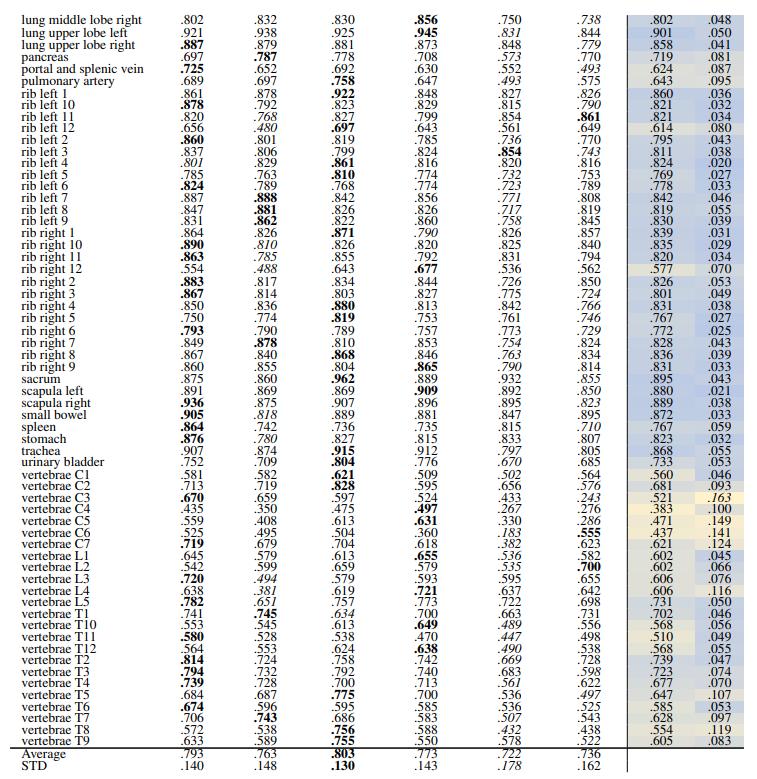
Localization-ratio The localization-ratio is computed based on (2). This measure shows how many slices that contributed to the retrieval of the volume actually contained the desired organ. Table 10 and Table 11 show the localization-ratio for 29 coarse and 104 TS original classes. DreamSim shows the best average localization-ratio with an average localization-ratio of .864 ± .145 and .803 ± .130 for coarse and original TS classes, respectively.
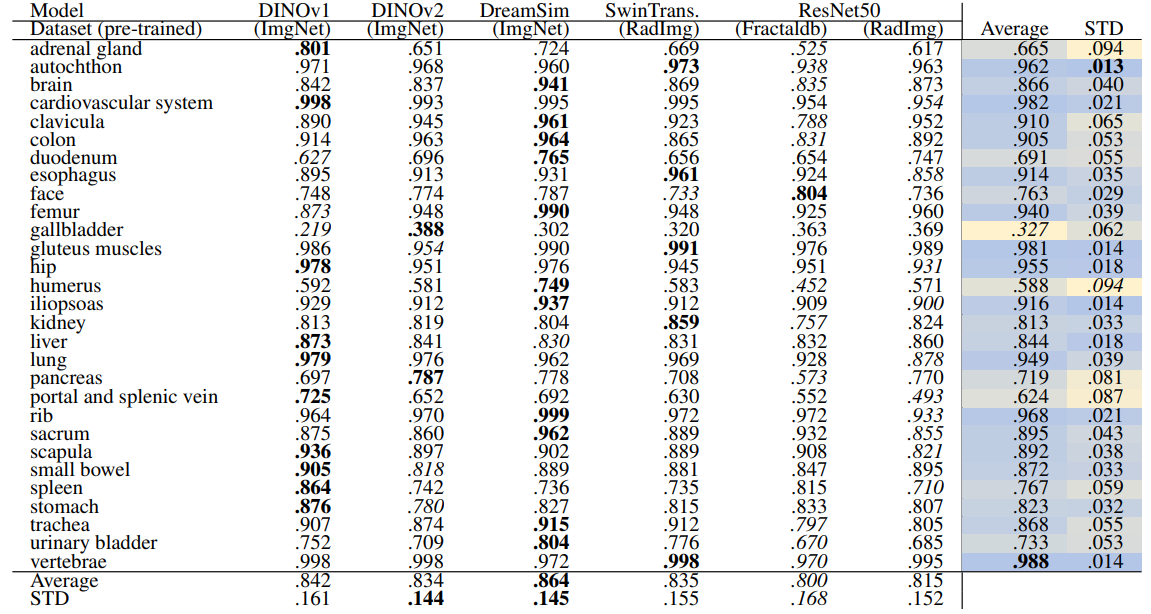
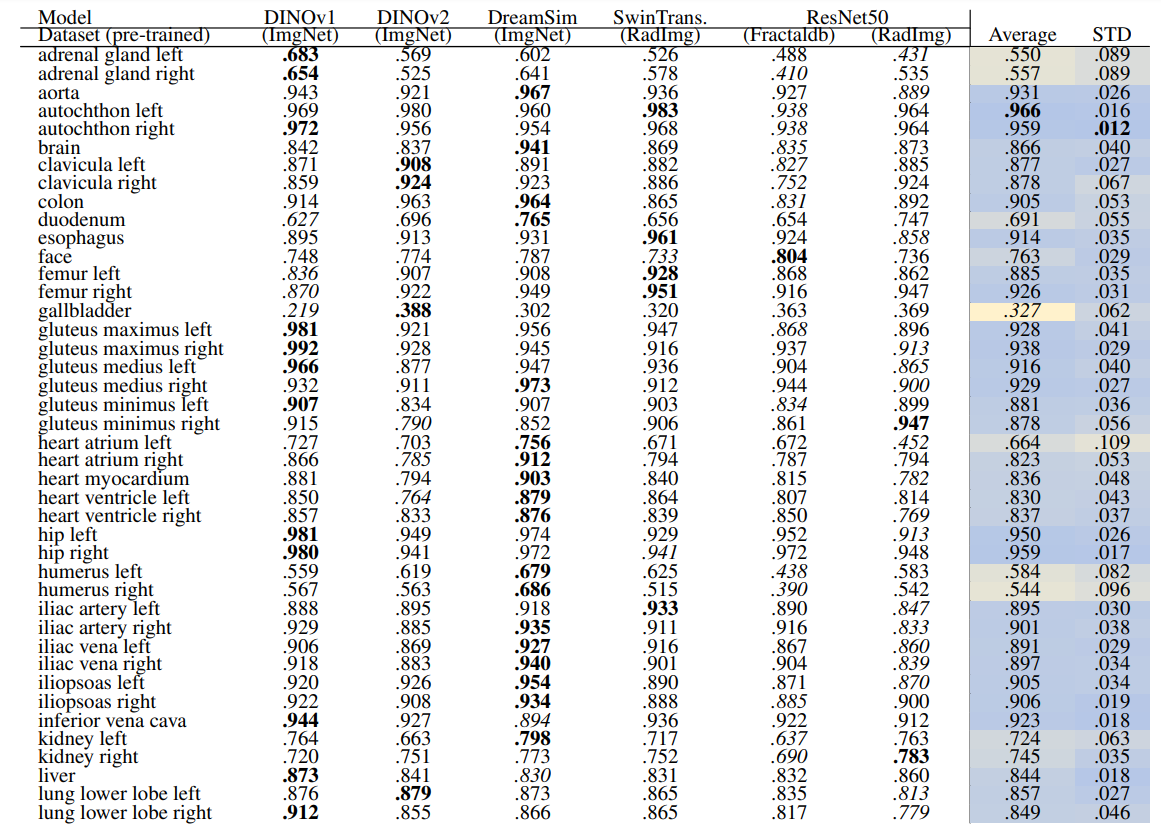
Table 10: Localization-ratio of coarse anatomical regions (29 classes) using HNSW Indexing, L = 15. In each row, bold numbers represent the best-performing values, while italicized numbers indicate the worst-performing. The separate average and standard deviation (STD) columns are color-coded, with blue indicating the best-performing values and yellow indicating the worst-performing values across different models. Additionally, bold numbers in colored columns represent the best classes in terms of average and standard deviation, while italicized values represent the worst-performing class across the models.

Continue with the next figure

Table 11: Localization-ratio of all TS anatomical regions (104 classes) using HNSW Indexing, L = 15. In each row, bold numbers represent the best-performing values, while italicized numbers indicate the worst-performing. The separate average and standard deviation (STD) columns are color-coded, with blue indicating the best-performing values and yellow indicating the worst-performing values across different models. Additionally, bold numbers in colored columns represent the best classes in terms of average and standard deviation, while italicized values represent the worst-performing class across the models

:::info
Authors:

(1) Farnaz Khun Jush, Bayer AG, Berlin, Germany ([email protected]);

(2) Steffen Vogler, Bayer AG, Berlin, Germany ([email protected]);

(3) Tuan Truong, Bayer AG, Berlin, Germany ([email protected]);

(4) Matthias Lenga, Bayer AG, Berlin, Germany ([email protected]).

:::


:::info
This paper is available on arxiv under CC BY 4.0 DEED license.

:::

Sign Up For Daily Newsletter

Be keep up! Get the latest breaking news delivered straight to your inbox.
By signing up, you agree to our Terms of Use and acknowledge the data practices in our Privacy Policy. You may unsubscribe at any time.
Share This Article
Facebook Twitter Email Print
Share
What do you think?
Love0
Sad0
Happy0
Sleepy0
Angry0
Dead0
Wink0
Previous Article DJI’s latest wireless microphone is smaller, cheaper and more pro-friendly than its predecessor | Stuff
Next Article The adoption of AI increases the risks to which the fissos must face
Leave a comment

Leave a Reply Cancel reply

Your email address will not be published. Required fields are marked *

Stay Connected

248.1k Like
69.1k Follow
134k Pin
54.3k Follow

Latest News

Seattle startups Clarify, Dropzone AI, Statsig, land on Madrona’s latest IA40 list of top AI companies
Computing
Apple Releases Xcode 26 Beta 7 With GPT-5 Support and Claude Integration
News
More Logistics Layoffs as 600 FedEx Employees Face the Chop
News
I installed these PowerShell modules and they changed how I work
Computing

You Might also Like

Computing

Seattle startups Clarify, Dropzone AI, Statsig, land on Madrona’s latest IA40 list of top AI companies

3 Min Read
Computing

I installed these PowerShell modules and they changed how I work

8 Min Read
Computing

Stablecoins make up 43% of crypto transactions, businesses lead

4 Min Read
Computing

How to Conduct a Project Retrospective That Drives Change

23 Min Read
//

World of Software is your one-stop website for the latest tech news and updates, follow us now to get the news that matters to you.

Quick Link

  • Privacy Policy
  • Terms of use
  • Advertise
  • Contact

Topics

  • Computing
  • Software
  • Press Release
  • Trending

Sign Up for Our Newsletter

Subscribe to our newsletter to get our newest articles instantly!

World of SoftwareWorld of Software
Follow US
Copyright © All Rights Reserved. World of Software.
Welcome Back!

Sign in to your account

Lost your password?