Content Overview
- Best practice summary
- Reproducing the figures
- The dataset
- The iteration loop
- The plotting method
- Use wrappers for mapped function
- Pipeline comparisons
- Optimized
Best practice summary
Here is a summary of the best practices for designing performant TensorFlow input pipelines:
- Use the
prefetchtransformation to overlap the work of a producer and consumer - Parallelize the data reading transformation using the
interleavetransformation - Parallelize the
maptransformation by setting thenum_parallel_callsargument - Use the
cachetransformation to cache data in memory during the first epoch - Vectorize user-defined functions passed in to the
maptransformation - Reduce memory usage when applying the
interleave,prefetch, andshuffletransformations
Reproducing the figures
Note: The rest of this notebook is about how to reproduce the above figures. Feel free to play around with this code, but understanding it is not an essential part of this tutorial.
To go deeper in the tf.data.Dataset API understanding, you can play with your own pipelines. Below is the code used to plot the images from this guide. It can be a good starting point, showing some workarounds for common difficulties such as:
- Execution time reproducibility
- Mapped functions eager execution
interleavetransformation callable
import itertools
from collections import defaultdict

import numpy as np
import matplotlib as mpl
import matplotlib.pyplot as plt
The dataset
Similar to the ArtificialDataset you can build a dataset returning the time spent in each step.
class TimeMeasuredDataset(tf.data.Dataset):
    # OUTPUT: (steps, timings, counters)
    OUTPUT_TYPES = (tf.dtypes.string, tf.dtypes.float32, tf.dtypes.int32)
    OUTPUT_SHAPES = ((2, 1), (2, 2), (2, 3))

    _INSTANCES_COUNTER = itertools.count()  # Number of datasets generated
    _EPOCHS_COUNTER = defaultdict(itertools.count)  # Number of epochs done for each dataset

    def _generator(instance_idx, num_samples):
        epoch_idx = next(TimeMeasuredDataset._EPOCHS_COUNTER[instance_idx])

        # Opening the file
        open_enter = time.perf_counter()
        time.sleep(0.03)
        open_elapsed = time.perf_counter() - open_enter

        for sample_idx in range(num_samples):
            # Reading data (line, record) from the file
            read_enter = time.perf_counter()
            time.sleep(0.015)
            read_elapsed = time.perf_counter() - read_enter

            yield (
                [("Open",), ("Read",)],
                [(open_enter, open_elapsed), (read_enter, read_elapsed)],
                [(instance_idx, epoch_idx, -1), (instance_idx, epoch_idx, sample_idx)]
            )
            open_enter, open_elapsed = -1., -1.  # Negative values will be filtered


    def __new__(cls, num_samples=3):
        return tf.data.Dataset.from_generator(
            cls._generator,
            output_types=cls.OUTPUT_TYPES,
            output_shapes=cls.OUTPUT_SHAPES,
            args=(next(cls._INSTANCES_COUNTER), num_samples)
        )
This dataset provides samples of shape [[2, 1], [2, 2], [2, 3]] and of type [tf.dtypes.string, tf.dtypes.float32, tf.dtypes.int32]. Each sample is:
(
  [("Open"), ("Read")],
  [(t0, d), (t0, d)],
  [(i, e, -1), (i, e, s)]
)
Where:
OpenandReadare steps identifierst0is the timestamp when the corresponding step starteddis the time spent in the corresponding stepiis the instance indexeis the epoch index (number of times the dataset has been iterated)sis the sample index
The iteration loop
Make the iteration loop a little bit more complicated to aggregate all timings. This will only work with datasets generating samples as detailed above.
def timelined_benchmark(dataset, num_epochs=2):
    # Initialize accumulators
    steps_acc = tf.zeros([0, 1], dtype=tf.dtypes.string)
    times_acc = tf.zeros([0, 2], dtype=tf.dtypes.float32)
    values_acc = tf.zeros([0, 3], dtype=tf.dtypes.int32)

    start_time = time.perf_counter()
    for epoch_num in range(num_epochs):
        epoch_enter = time.perf_counter()
        for (steps, times, values) in dataset:
            # Record dataset preparation informations
            steps_acc = tf.concat((steps_acc, steps), axis=0)
            times_acc = tf.concat((times_acc, times), axis=0)
            values_acc = tf.concat((values_acc, values), axis=0)

            # Simulate training time
            train_enter = time.perf_counter()
            time.sleep(0.01)
            train_elapsed = time.perf_counter() - train_enter

            # Record training informations
            steps_acc = tf.concat((steps_acc, [["Train"]]), axis=0)
            times_acc = tf.concat((times_acc, [(train_enter, train_elapsed)]), axis=0)
            values_acc = tf.concat((values_acc, [values[-1]]), axis=0)

        epoch_elapsed = time.perf_counter() - epoch_enter
        # Record epoch informations
        steps_acc = tf.concat((steps_acc, [["Epoch"]]), axis=0)
        times_acc = tf.concat((times_acc, [(epoch_enter, epoch_elapsed)]), axis=0)
        values_acc = tf.concat((values_acc, [[-1, epoch_num, -1]]), axis=0)
        time.sleep(0.001)

    tf.print("Execution time:", time.perf_counter() - start_time)
    return {"steps": steps_acc, "times": times_acc, "values": values_acc}
The plotting method
Finally, define a function able to plot a timeline given the values returned by the timelined_benchmark function.
def draw_timeline(timeline, title, width=0.5, annotate=False, save=False):
    # Remove invalid entries (negative times, or empty steps) from the timelines
    invalid_mask = np.logical_and(timeline['times'] > 0, timeline['steps'] != b'')[:,0]
    steps = timeline['steps'][invalid_mask].numpy()
    times = timeline['times'][invalid_mask].numpy()
    values = timeline['values'][invalid_mask].numpy()

    # Get a set of different steps, ordered by the first time they are encountered
    step_ids, indices = np.stack(np.unique(steps, return_index=True))
    step_ids = step_ids[np.argsort(indices)]

    # Shift the starting time to 0 and compute the maximal time value
    min_time = times[:,0].min()
    times[:,0] = (times[:,0] - min_time)
    end = max(width, (times[:,0]+times[:,1]).max() + 0.01)

    cmap = mpl.cm.get_cmap("plasma")
    plt.close()
    fig, axs = plt.subplots(len(step_ids), sharex=True, gridspec_kw={'hspace': 0})
    fig.suptitle(title)
    fig.set_size_inches(17.0, len(step_ids))
    plt.xlim(-0.01, end)

    for i, step in enumerate(step_ids):
        step_name = step.decode()
        ax = axs[i]
        ax.set_ylabel(step_name)
        ax.set_ylim(0, 1)
        ax.set_yticks([])
        ax.set_xlabel("time (s)")
        ax.set_xticklabels([])
        ax.grid(which="both", axis="x", color="k", linestyle=":")

        # Get timings and annotation for the given step
        entries_mask = np.squeeze(steps==step)
        serie = np.unique(times[entries_mask], axis=0)
        annotations = values[entries_mask]

        ax.broken_barh(serie, (0, 1), color=cmap(i / len(step_ids)), linewidth=1, alpha=0.66)
        if annotate:
            for j, (start, width) in enumerate(serie):
                annotation = "n".join([f"{l}: {v}" for l,v in zip(("i", "e", "s"), annotations[j])])
                ax.text(start + 0.001 + (0.001 * (j % 2)), 0.55 - (0.1 * (j % 2)), annotation,
                        horizontalalignment='left', verticalalignment='center')
    if save:
        plt.savefig(title.lower().translate(str.maketrans(" ", "_")) + ".svg")
Use wrappers for mapped function
To run mapped function in an eager context, you have to wrap them inside a tf.py_function call.
def map_decorator(func):
    def wrapper(steps, times, values):
        # Use a tf.py_function to prevent auto-graph from compiling the method
        return tf.py_function(
            func,
            inp=(steps, times, values),
            Tout=(steps.dtype, times.dtype, values.dtype)
        )
    return wrapper
Pipelines comparison
_batch_map_num_items = 50

def dataset_generator_fun(*args):
    return TimeMeasuredDataset(num_samples=_batch_map_num_items)
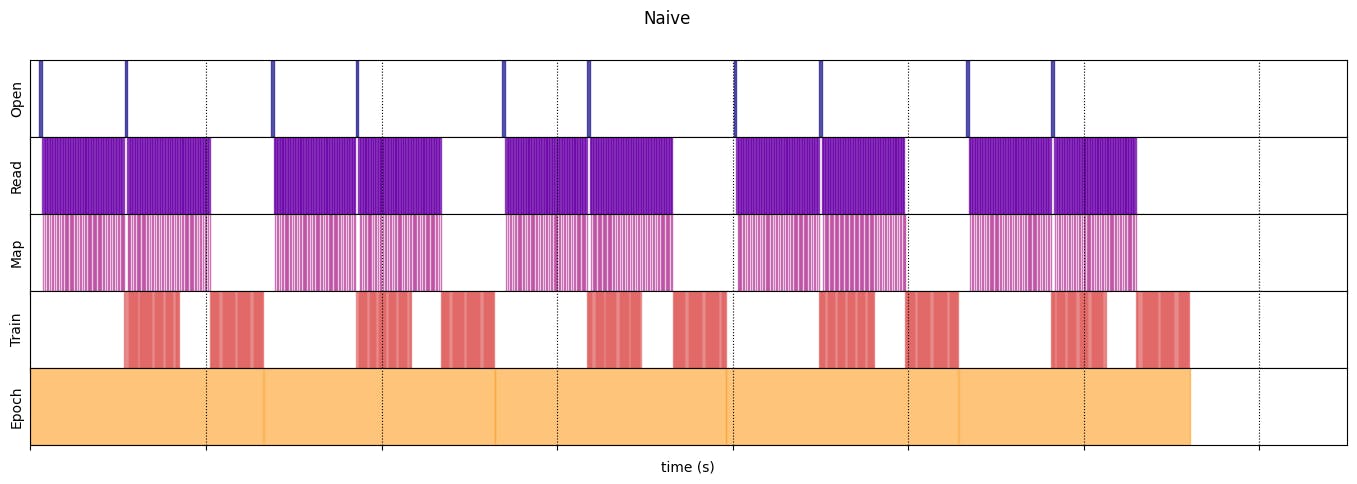
Naive
@map_decorator
def naive_map(steps, times, values):
    map_enter = time.perf_counter()
    time.sleep(0.001)  # Time consuming step
    time.sleep(0.0001)  # Memory consuming step
    map_elapsed = time.perf_counter() - map_enter

    return (
        tf.concat((steps, [["Map"]]), axis=0),
        tf.concat((times, [[map_enter, map_elapsed]]), axis=0),
        tf.concat((values, [values[-1]]), axis=0)
    )

naive_timeline = timelined_benchmark(
    tf.data.Dataset.range(2)
    .flat_map(dataset_generator_fun)
    .map(naive_map)
    .batch(_batch_map_num_items, drop_remainder=True)
    .unbatch(),
    5
)
WARNING:tensorflow:From /tmpfs/tmp/ipykernel_112933/64197174.py:32: calling DatasetV2.from_generator (from tensorflow.python.data.ops.dataset_ops) with output_types is deprecated and will be removed in a future version.
Instructions for updating:
Use output_signature instead
WARNING:tensorflow:From /tmpfs/tmp/ipykernel_112933/64197174.py:32: calling DatasetV2.from_generator (from tensorflow.python.data.ops.dataset_ops) with output_shapes is deprecated and will be removed in a future version.
Instructions for updating:
Use output_signature instead
Execution time: 13.208576904999973
Optimized
@map_decorator
def time_consuming_map(steps, times, values):
    map_enter = time.perf_counter()
    time.sleep(0.001 * values.shape[0])  # Time consuming step
    map_elapsed = time.perf_counter() - map_enter

    return (
        tf.concat((steps, tf.tile([[["1st map"]]], [steps.shape[0], 1, 1])), axis=1),
        tf.concat((times, tf.tile([[[map_enter, map_elapsed]]], [times.shape[0], 1, 1])), axis=1),
        tf.concat((values, tf.tile([[values[:][-1][0]]], [values.shape[0], 1, 1])), axis=1)
    )


@map_decorator
def memory_consuming_map(steps, times, values):
    map_enter = time.perf_counter()
    time.sleep(0.0001 * values.shape[0])  # Memory consuming step
    map_elapsed = time.perf_counter() - map_enter

    # Use tf.tile to handle batch dimension
    return (
        tf.concat((steps, tf.tile([[["2nd map"]]], [steps.shape[0], 1, 1])), axis=1),
        tf.concat((times, tf.tile([[[map_enter, map_elapsed]]], [times.shape[0], 1, 1])), axis=1),
        tf.concat((values, tf.tile([[values[:][-1][0]]], [values.shape[0], 1, 1])), axis=1)
    )


optimized_timeline = timelined_benchmark(
    tf.data.Dataset.range(2)
    .interleave(  # Parallelize data reading
        dataset_generator_fun,
        num_parallel_calls=tf.data.AUTOTUNE
    )
    .batch(  # Vectorize your mapped function
        _batch_map_num_items,
        drop_remainder=True)
    .map(  # Parallelize map transformation
        time_consuming_map,
        num_parallel_calls=tf.data.AUTOTUNE
    )
    .cache()  # Cache data
    .map(  # Reduce memory usage
        memory_consuming_map,
        num_parallel_calls=tf.data.AUTOTUNE
    )
    .prefetch(  # Overlap producer and consumer works
        tf.data.AUTOTUNE
    )
    .unbatch(),
    5
)
Execution time: 6.8234945540007175
draw_timeline(naive_timeline, "Naive", 15)
/tmpfs/tmp/ipykernel_112933/2966908191.py:17: MatplotlibDeprecationWarning: The get_cmap function was deprecated in Matplotlib 3.7 and will be removed in 3.11. Use ``matplotlib.colormaps[name]`` or ``matplotlib.colormaps.get_cmap()`` or ``pyplot.get_cmap()`` instead.
  cmap = mpl.cm.get_cmap("plasma")


draw_timeline(optimized_timeline, "Optimized", 15)
/tmpfs/tmp/ipykernel_112933/2966908191.py:17: MatplotlibDeprecationWarning: The get_cmap function was deprecated in Matplotlib 3.7 and will be removed in 3.11. Use ``matplotlib.colormaps[name]`` or ``matplotlib.colormaps.get_cmap()`` or ``pyplot.get_cmap()`` instead.
  cmap = mpl.cm.get_cmap("plasma")


Originally published on the


