Table of Links
Abstract and 1. Introduction
2. Related Work
3 Background
3.1 Blockchain and DeFi
3.2 Ethereum PoS
3.3 Staking Options
3.4 LSD
3.5 DeFi Lending Protocols
4 System Model and 4.1 System Participants
4.2 Leverage Staking with LSDs
5 Analytical Study
6 Empirical Study
7 Cascading Liquidation
7.1 stETH Price Deviation and Terra Crash
7.2 Cascading Liquidation and User Behaviors
8 Stress Testing
8.1 Motivation and 8.2 Simulation
9 Discussion and Future Research Directions
10 Conclusion and References
A. Aave Parameter Configuration
B. Generalized Formalization For Leverage Staking
C. Leverage Staking Detection Algorithm
8 Stress Testing
8.1 Motivation
By crawling the liquidationcall events on Aave V2 lending pool from Dec 17, 2020 to Aug 7, 2023, we identify 18 liquidations for the positions where users supplied stETH to borrow ETH, 7 liquidations for direct leverage staking positions, and 2 liquidations for indirect leverage staking positions. This relatively low number of liquidations can be attributed to the fact that stETH has historically only experienced a modest price decline (reaching a low of 0.931). However, drawing from the LUNA–UST incident, we recognize that a token may become entirely devalued. Should stETH undergo a devaluation similar to that of LUNA, it could trigger a surge in liquidations. Therefore, it is crucial to conduct stress tests to assess the risk of cascading liquidations under the worst-case scenario.
8.2 Simulation
SQ1 How are leverage staking positions affected by stETH devaluation?
SQ2 How does the liquidation of leverage staking positions affect the price of stETH?
SQ3 How do leverage staking positions affect ordinary positions during stETH devaluation?
SQ4 What are the effects of deleveraging actions on stETH price and market participants?
We first categorize Aave collateralized stETH borrowing positions into two groups: the leverage staking group (GL) and the ordinary group (GO). We then simulate four distinct scenarios to investigate the answers to the corresponding SQs.
8.2.1 SQ1
SQ1 aims to simulate the experience of leverage staking positions during the steep drop of the stETH price. Our analysis centers on the fluctuations in HFs and examines how leverage staking intensifies the risk of cascading liquidations.
Simulation Setup. We initialize the Curve stETH–ETH pool by forking its state at block 17,500,000 (Jun 17, 2023), with reserve of 265,972 ETH and 266,966 stETH. Subsequently, we mimic the institutional selling pressure (e.g., Celsius, see Figure 18) after Terra crash by simulating a sale of 170,000 stETH on Curve. This sizable transaction leads to the decline in the stETH price, resulting in a new exchange rate of 100 stETH = 90.52 ETH, denoted as p0 = 0.9052. In addition, we initialize GL with 262 direct and 180 indirect leverage staking positions, each with an address that we have detected in Section 6. For each position, the values of totalDebtETH, totalCollateralETH, and HF are set to the corresponding values recorded in the transaction logs of that position’s most recent borrowing transaction. Furthermore, the stETHPrice for all positions is initialized as p0.
Simulation Process. The simulation consists of a series of sequential rounds. In each round, the stETHPrice for all positions is updated as the current stETH price in the Curve stETH–ETH pool. Subsequently, the HF for each position is recalculated, using the updated stETHPrice. If, at any point, a position’s HF drops below the threshold of HF = 1, a simulated liquidation event is triggered. In this scenario, a designated liquidator steps in to settle the debt by repaying it in ETH. In return, the liquidator receives the collateral in stETH. All received stETH is converted to ETH in the Curve stETH–ETH pool, as shown in Figure 18. This process continues until no more liquidatable positions remain.


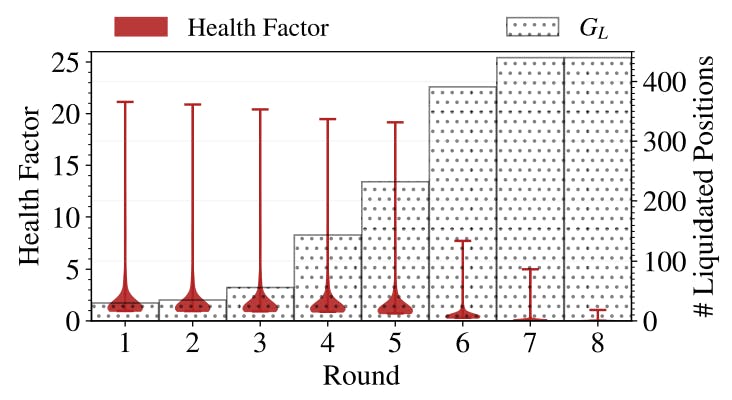
Simulation Result. We examine the liquidation dynamics of GL’s leverage staking positions and the fluctuations in their HFs throughout simulations. Figure 21 shows the number of liquidated users in group GL and the variations in HFs across different simulation rounds. The simulation terminates after 8 rounds, where 440 (99.55%) positions are liquidated. A noteworthy observation is that HFs of all positions exhibit a steep decrease, as depicted in Figure 22. The liquidation cascades experienced by leverage staking positions result in a total liquidated amount 497,375 ETH, ultimately driving the stETH price down to 0.01 ETH.
8.2.2 SQ2
SQ2 aims to explore how the liquidation of leverage staking positions can impact the price of stETH. We first simulate a scenario to evaluate the effects of leverage staking strategies (GL), followed by a contrasting scenario where users do not adopt these strategies. The selling pressure originates from the liquidation of the corresponding positions.


In our simulation, we first simulate a scenario to assess the impact of leverage staking on stETH price and the liquidation volume. Next, we simulate an alternative scenario in which users within group GL, which includes 262 direct and 180 indirect leverage staking positions, do not adopt leverage staking strategies. This involves setting the initial values for totalCollateralETHs, totalDebtETHs, and HFs as the values recorded in the transaction logs when the first borrowing action for the position occurred.
Figure 23 illustrates the comparative simulation results for scenarios in which users either adopt or do not adopt the leverage staking strategy. In the absence of leverage staking, the stETH price stabilized at 0.84 ETH in the last rounds, leading to a comparatively modest liquidation amount of 28,201 ETH. However, with the application of leverage staking,


the stETH price plummeted to 0.01 ETH at the end of the simulation, and the liquidation amount (497,375 ETH) escalated to 16 times that of the scenario where such strategies were not applied. Our simulation findings indicate that the adoption of leverage staking strategies significantly exacerbates the risk of cascading liquidation in response to market downturns. This underscores the importance of prudent risk management within the LSD system. Implementing such strategies without careful consideration of their potential impact on market stability can lead to adverse outcomes that affect a wide range of stakeholders.
8.2.3 SQ3
SQ3 aims to explore the impact of leverage staking positions on ordinary positions during the steep decline of stETH value. This simulation constructs two scenarios: a control scenario, which involves only the ordinary group (GO) consisting of 442 users, and an experimental scenario, where GL (442 users) and GO (442 users) coexist on the Aave platform. Both scenarios are subjected to identical simulation processes to record the number of liquidated positions within GO and the fluctuations in the stETH price, allowing for a direct comparison of outcomes with and without the influence of leverage staking.


The simulation results for the control scenario (see Figure 24) indicate that 75 ordinary positions are liquidated in the absence of GL. In contrast, the results for the experimental scenario (see Figure 25) reveal that 260 ordinary positions are liquidated, suggesting a significant increase in liquidations when GL is present. Our simulation results suggest that leverage staking not only intensifies the risk profile of individual portfolios but also contributes to broader systemic risks, particularly during periods of sharp declines in LSD prices. The comparative analysis of liquidation rates between the two scenarios underscores the influence that leverage staking positions can exert on the stability of ordinary positions. The increased liquidations in the presence of GL point to a contagion effect, where vulnerabilities in leveraged positions can cascade to affect even traditionally less risky, ordinary positions. This suggests that systems designed to stabilize market dynamics need to account not only for individual positions but also for their interdependencies. Therefore, our simulation results highlight the necessity for regulatory frameworks and platform governance structures to consider these interconnections.
8.2.4 SQ4
As discussed in Section 7.2, users holding leverage staking positions might choose to deleverage during a decline in stETH value. SQ4 is designed to examine the effects of such deleveraging actions on the stETH price and LSD market participants. We simulate two scenarios: the control scenarios where GL does not deleverage and the experimental scenarios where GL chooses to deleverage at the beginning of the simulation (round 0).


When users in GL do not choose to deleverage, our simulation result (see Figure 26) shows that the liquidation ends in 7 round, with 441 users in GL and 440 users in GO being liquidated. Conversely, when GL decides to deleverage at round 0, the liquidation process is significantly shortened, ending in just 3 rounds. This pronounced difference underscores the critical role that deleveraging actions play in market dynamics. Not only do they shorten the duration of liquidations, but they also potentially amplify market volatility by introducing additional selling pressure. This indicates that deleveraging action can exacerbate systemic risk by accelerating the liquidation cascade, affecting a broader range of system participants.
Authors:
(1) Xihan Xiong, Imperial College London, UK;
(2) Zhipeng Wang, Imperial College London, UK;
(3) Xi Chen, University of Sussex, UK;
(4) William Knottenbelt, Imperial College London, UK;
(5) Michael Huth, Imperial College London, UK.


