
How We Saved $110K in 90 Days by Rebuilding BI Before the Architecture Broke.
The Dashboard We Didn’t Want to Open.
Most dashboards show what’s happening in the business. n This one showed what was happening to our BI architecture.
It looked like this:
A jagged skyline of $800 – $1,400 cost spikes.
Wild swings between days.
A dotted trendline barely drifting downward.
It wasn’t random – it was a heartbeat monitor for a system under stress.
This dashboard became the one we avoided until the day we realized it was the only one that mattered.
ACT 1 – The Hidden Cost of “Everything Real-Time”.
For years, our BI ecosystem did what most retail BI ecosystems do:
- Build big semantic models.
- Keep everything real-time “just to be safe”.
- Give stores dashboards connected directly to the warehouse.
- Let self-service teams create dozens of near-duplicate datasets.
- Refresh everything “as often as possible”.
- Hope the cloud bill stays reasonable.
- And with hundreds of stores and headquarters all hitting the same semantic models, every “live” interaction multiplied our warehouse load instantly.
It worked – until it didn’t.
The chart revealed the problem we weren’t measuring.
DirectQuery was silently multiplying our costs.
Every click → a live query n Every filter → a live query n Every store and HQ team → dozens of live queries per minute
And our largest models were so big they could never be imported, which meant:
- No caching
- No query folding
- No cost control
- No way to protect the warehouse from user traffic
The problem wasn’t our Cloud Warehouse. The problem was the architecture we had built on top of it.
And the chart was its confession.
ACT 2 – The First Structural Break.
Look at the chart around March 28. n The cost line suddenly dips – permanently.
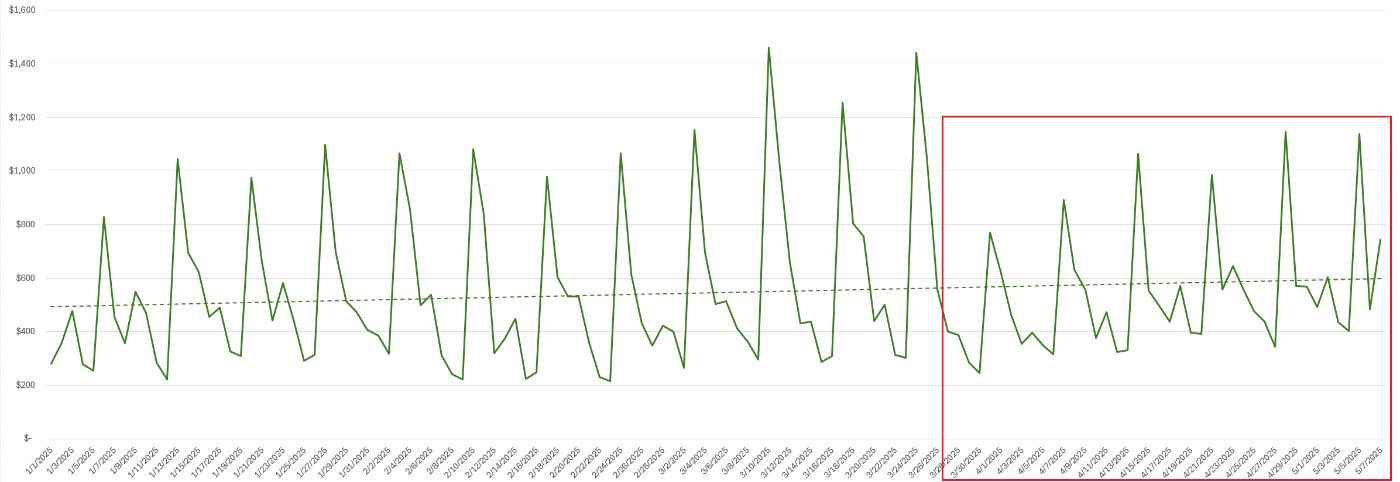
That was the first major intervention.
We took our giant 500M+ row models – the ones too large to import and split them into two logical pieces:
- Purpose-built, optimized Warehouse tables/views, aligned to actual reporting use cases.
- Semantic model designed around those pieces, making import mode not only possible but fast.
The entire system underwent a complete transformation because of this single architectural choice:
- The dashboards system transitioned to an import-based operation.
- The system required less DirectQuery operations after implementing the change.
- The system achieved its successful cache operation.
- The system provided an efficient system to handle all incoming requests.
And the chart reflected it instantly.
This wasn’t tuning. n This was a structural correction to BI debt that had been accumulating for years.
ACT 3 – The Second Structural Break.
A 5-Minute Hybrid That Replaced Real-Time.
The first act killed the ugliest spikes, but the chart made it clear we weren’t done yet. The problem remained visible although it had reduced in size.
The need for real-time dashboard data for critical operational decisions locked us into DirectQuery and that’s what drove the remaining cost spikes.
The solution we created during that year turned out to be one of our most important accomplishment.
A 5-minute incremental-refresh import model.
It worked like this:
- Import a small rolling window.
- Refresh it every 5 minutes.
- Only refresh the latest partition.
- Allow all stores to hit a shared Fabric cache.
- Keep the experience “live enough” without the cost of real-time.
To the business, it felt identical to real-time. To the warehouse, it reduced load from hundreds of hits per minute to one hit every 5 minutes.
If you look at the chart around May 8, you’ll see the second drop and the point where the chaos stops.
After May 8, the chaotic spikes disappear the architecture finally enters a stable, predictable pattern.
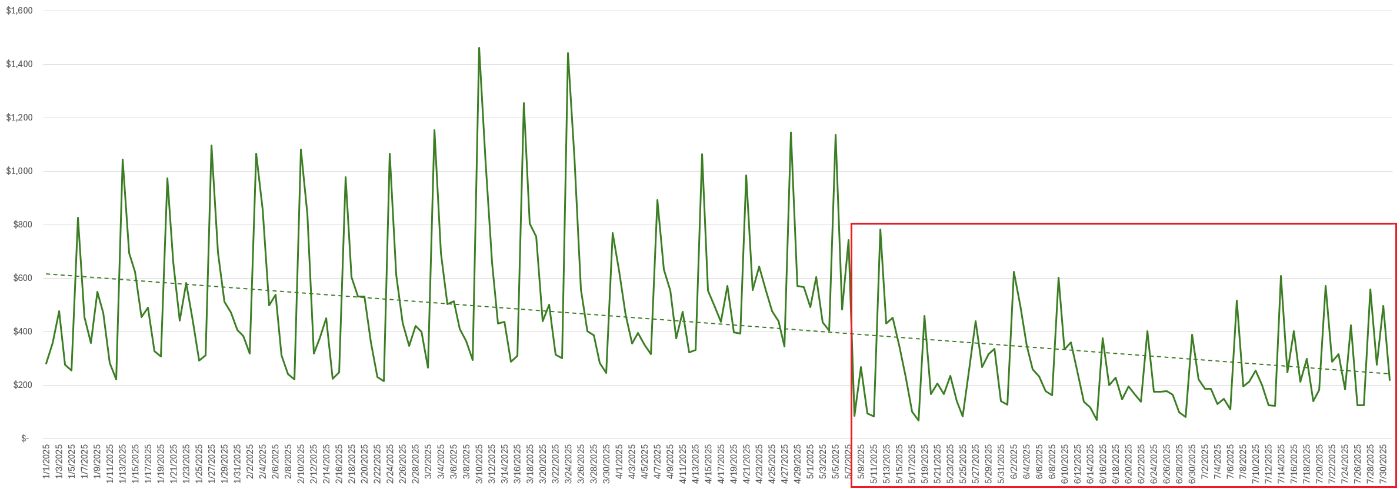
From that day forward, cost became:
- Stable.
- Predictable.
- Architecture-driven.
Spikes didn’t come back because the architectural cause of the spikes no longer existed.
ACT 4 – The 90-Day Outcome
Here’s what 90 days of BI re-architecture delivered:
| Metric | Before | After |
|—-|—-|—-|
| Avg Daily BigQuery Cost | ~$545 | ~$260 |
| Annual Spend | ~$199,000 | ~$95,000 |
| Annual Savings | – | ~$110,000 |
| Model Size | Too large to import | Split + optimized |
| DirectQuery Usage | Heavy | Minimal |
| Stability | Chaotic | Controlled |
And most importantly:
Data freshness remained fast.
Query performance improved. User experience stayed “live.”
We didn’t sacrifice capability – we designed it intentionally.
ACT 5 – What We Learned From the Architecture Collapse.
These 90 days taught us more about BI than any new tool could.
1. If a model is too big to import, it’s a cost problem.
Not a data problem. n Not a business problem. n A structural BI problem.
2. Real-time is a feeling, not a feature.
Most retail operations don’t need sub-second freshness – they need predictability.
3. DirectQuery should be the exception, not the default.
It looks easy. n It sounds flexible. n And it becomes expensive the moment users actually use it.
4. Refresh schedules are architectural decisions.
Every 5-minute refresh that doesn’t need to exist becomes a tax on the warehouse.
5. BI debt compounds silently until the cloud bill displays it.
Closing Thought
Architecture is invisible until it becomes expensive. n This chart made it visible.
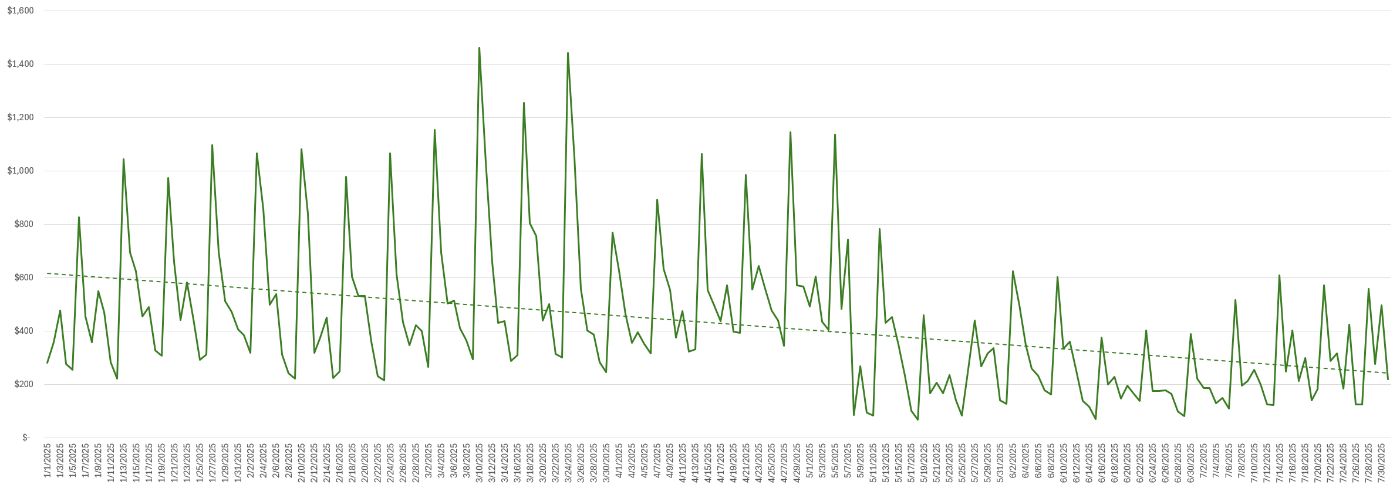
Two structural changes on 3/28 and 5/8 were enough to turn three months of chaos into a stable, predictable and affordable BI ecosystem.
Not by throttling. n Not by cutting features. n Not by downgrading experience.
But by designing BI intentionally around how the business actually needs data, not how queries happen by default.
Every BI team has a chart like this somewhere. n Most just haven’t looked at it yet.
And maybe that’s the real lesson here: BI is never done. n The architecture stabilizes, the cost drops, the charts flatten but the curiosity doesn’t.
I’m constantly exploring new approaches, rethinking old ones, and finding ways to make BI lighter, faster, and more meaningful.
Continuous improvement isn’t a requirement in BI – it’s the passion that keeps the whole discipline moving forward.


