
How one overused semantic model nearly crashed our BI capacity… and what we learned.
The Monday Morning Spike
It was a typical Monday morning in retail. Over 300 stores across the U.S. were preparing for the week ahead, printing their daily sales and inventory reports from Power BI.
Back at headquarters, the day started like any other – quiet hum of monitors, first sips of coffee, inbox filling up.
The first message arrived after that.
“Hey, my report’s not loading – can you please check, I need it for a meeting?”
A few minutes later, another.
“Hey, PowerBI is slow – can you please bump up the capacity ?”
Then three more.
The Teams window displayed a help-desk queue format which became visible within ten minutes.
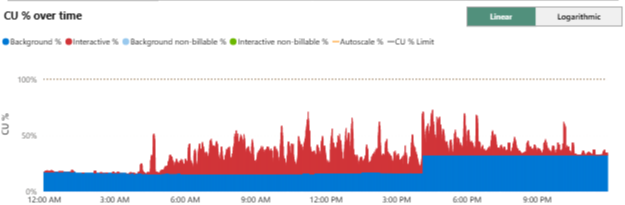
I accessed the Fabric capacity dashboard to find a minor issue that I expected to see. The entire range of the chart showed red values.
Utilization had spiked to 350 %, and I was completely taken aback.
The dashboards had become unresponsive while paginated reports took too long to load and the BI platform which supported 300 stores experienced critical performance issues.
The day had just started, and we were already in firefighting mode.
Tracing the Problem
Our first step was to open the Fabric Capacity Metrics dashboard. The utilization charts showed the highest usage because one workspace compute units suddenly reached its maximum capacity.
Digging deeper, we found one dataset consuming over 10× more compute than every other model combined.
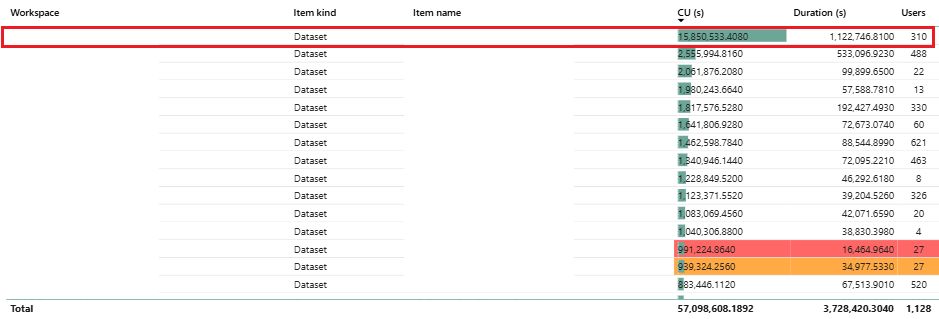
This was a critical dataset that allowed us to generate various paginated & regular reports which presented all detailed store-category performance information. It was a 20 million-row semantic model built by us which is the BI Center of Excellence for enterprise reporting. However, because our organization follows a self-service analytics model, anyone can build and share reports using this dataset. That flexibility is powerful but it also makes daily consumption difficult to monitor and control.
The operations followed their typical pattern until that specific week. So what changed?
We started tracing activity logs together with time windows and report connections. The system revealed a pattern which showed that 300 distinct users accessed the same model through store-facing paginated reports around the same time window.
To confirm, we disabled those reports for a single day.
The system operated at its peak capacity since the beginning of its operation.
We had our culprit.
n The Discovery: XMLA Read Operations
When we examined the detailed operations view, one metric dominated: XMLA Read Operations.
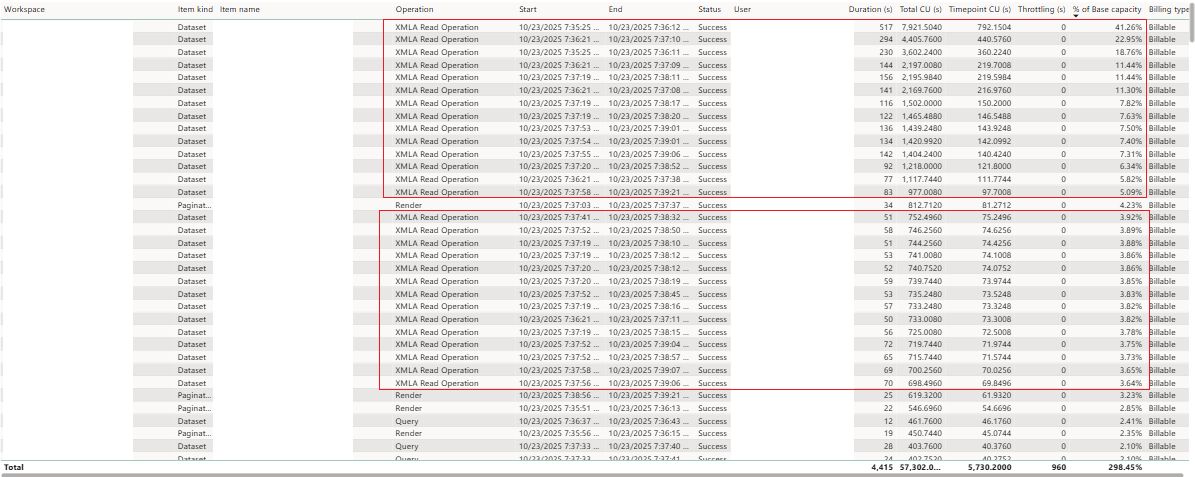
That was puzzling. The native Power BI feature Paginated Reports operated as external connections.
Microsoft’s own documentation gives the answer:
The XMLA endpoint enables read/write operations on Power BI Premium datasets which allows external tools and APIs to execute queries and control data models.
The XMLA endpoint enables Paginated Reports to access semantic models in the same way that Excel, DAX Studio or any external system do. The dataset engine receives direct DAX batch execution from all page render and export operations.
As SQLBI notes:
Paginated reports generate high query concurrency because each rendered page executes its own DAX query batch.
Every store user printing reports was creating multiple XMLA sessions – each one a heavy, full read.
The standard Monday printing operation evolved into a distributed computing system breakdown.
Evaluating the Fixes
We discovered the root cause before we started testing different solutions until we discovered the effective method.
| Option | Description | Outcome |
|—-|—-|—-|
| Keep Live to BigQuery | Maintain DirectQuery to BigQuery to avoid imported semantic model. | ❌ Too costly; XMLA reads still consume Fabric compute. |
| Fabric-Ingested Tables | Ingest data into Fabric and use a DirectQuery in the semantic model. | ⚠️ Minor improvement but XMLA concurrency remained. |
| SQL Endpoint with OLE DB | Connect paginated reports directly to SQL endpoint. | ⚠️ Technically possible but complex; lost relationships and added IT overhead. |
| Lean Semantic Model (Chosen) | Create a simplified model with only necessary granularity and metrics. | ✅ Massive reduction in compute usage and stable performance. |
The Fix That Worked
The team developed a specific lean semantic model for paginated reports which included only required granularity and metrics.
When we deployed it, the following Monday told the story.
Peak utilization fell from 350 % to under 80%
The system produced paginated reports which operated without issues when more than 100 users accessed the system.
Interactive dashboards remained fast and stable.
The Fabric metrics dashboard showed that compute had been declining at a steady rate.
The leaner model achieved control through its simple design structure.
Why XMLA Read Operations Matter
The incident revealed that paginated reports rely on a different caching mechanism than interactive reports, and XMLA reads bypass caching entirely to query the dataset engine directly.
Any tool that uses XMLA to connect to Excel, Paginated Reports or custom scripts will use interactive compute units (CUs) from capacity for every query.
As TDWI research notes:
The main reason for capacity spikes stems from design patterns which fail to consider concurrent query execution instead of focusing on data volume.
The situation developed in the same way as described. The system processed multiple requests simultaneously which resulted in no change to our data volume.
For enterprise BI teams, that means performance planning is as much about usage behavior as it is about model size.
To avoid similar issues:
- Segment workloads: The system requires two distinct models to operate for interactive functions and paginated operations.
- Monitor XMLA operations: Fabric allows you to identify performance problems when they first appear through its operation-level metrics.
- Align capacity scaling: The system needs to execute SKU synchronization between lower and higher during their designated heavy operational periods.
What We Learned
Dashboards aren’t the main compute consumers. The performance of Paginated Reports deteriorates when the system operates under heavy workload conditions.
XMLA operates all sessions through a single level of access. The analysis process for one analyst and 300 stores follows the same computational route.
- Simplification beats complexity: A lean model produces superior results than complex multi-layered workarounds.
- Visibility prevents crisis: The Fabric Metrics app provided views with precise diagnostic capabilities instead of forcing them to base their decisions on uncertain assumptions.
- Governance equals performance: The organization needs to create particular guidelines which will specify when team members can access shared models.
- Self-service requires oversight: Teams gain significant power through report-building autonomy but need monitoring systems to track their activities and defined ownership rules. The absence of visibility during free access to resources leads to hidden shared resource overload.
- Caching isn’t universal: The caching behavior of interactive reports differs from paginated reports so organizations need to understand their query handling mechanisms to prevent unexpected compute spikes.
- Prevention is cheaper than recovery: Every new dataset implementation now includes workload segmentation and XMLA monitoring as standard features. The implementation of preventive governance measures during design phase produces greater benefits than emergency solution work.
The Bigger Picture
The reliability issue affected multiple models because it needed proper operation of both architectural design and governance systems.
The operations of Retail BI depend on a rhythmic pattern because it needs real-time data to make decisions about pricing, staffing, fulfillment and sales operations. The system fails to operate properly when its processing ability reaches its highest point.
As MIT Sloan Management Review writes:
Analytics leaders outperform others not by producing more reports, but by governing how data is consumed.
Our systems underwent a redesign to handle load and ownership which enabled us to shift from emergency-based firefighting to scheduled governance.
The main focus of BI goes beyond fast data delivery because it requires dependable decision-making support.
Closing Thought
The lesson from that Monday became a permanent truth which we learnt.
The actual cause of system capacity failures stems from design choices that were made without proper knowledge of system operations.
Dashboards visualize data.
Paginated reports distribute it.
But BI engineers govern how it all holds together.
The compute spike received a solution but our team found the critical link between Fabric, XMLA and governance systems which support enterprise analytics stability.
Next time, when 300 stores print again, we’ll be ready.
About the Author
Rupesh Ghosh works as a Lead Business Intelligence Engineer at Total Wine & More while pursuing his Executive PhD in Business at the University of Cumberlands. His research interests include data governance, decision intelligence, project management and cost-effective BI analytics.


