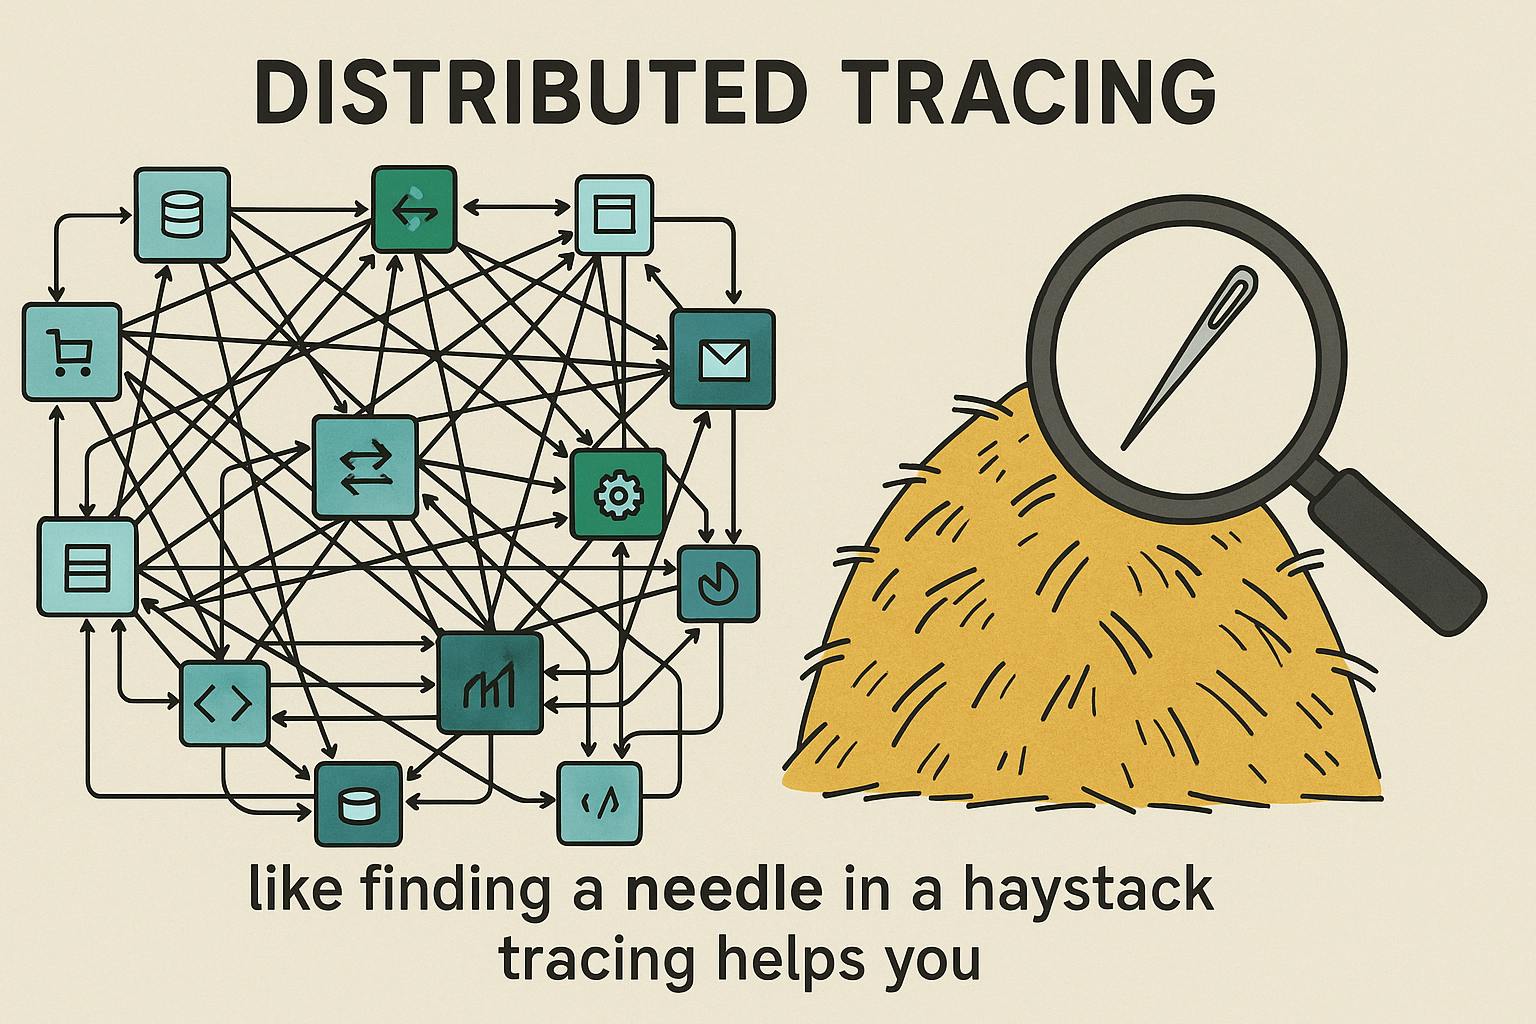
When your microservices architecture resembles a complex spider web, how do you track down that one frustrating bottleneck causing your customers pain?
The Modern Observability Challenge
It’s 3 AM. Your phone buzzes with an alert. A critical API is responding slowly, with angry customer tweets already appearing. Your architecture spans dozens of microservices across multiple cloud providers. Where do you even begin?
Without distributed tracing, you’re reduced to:
-
Checking individual service metrics, trying to guess which might be the culprit
-
Digging through thousands of log lines across multiple services
-
Manually correlating timestamps to guess at request paths
-
Hoping someone on your team remembers how everything connects
But with distributed tracing in place, you can:
- See the entire request flow from frontend to database and back
- Immediately identify which specific service is introducing latency
- Pinpoint exact database queries, API calls, or code blocks causing the problem
- Deploy a targeted fix within minutes instead of hours
As Ben Sigelman, co-creator of OpenTelemetry, puts it: “Distributed systems have become the norm, not the exception, and with that transition comes a new class of observability challenges.”
The Three Pillars of Observability
- Logs: Detailed records of discrete events
- Metrics: Aggregated numerical measurements over time
- Traces: End-to-end request flows across distributed systems
Charity Majors, CTO at Honeycomb, explains their relationship: “Metrics tell you something’s wrong. Logs might tell you what’s wrong. Traces tell you why and where it’s wrong.”
What Is Distributed Tracing?
Distributed tracing tracks requests as they propagate through distributed systems, creating a comprehensive picture showing:
- The path taken through various services
- Time spent in each component
- Dependency relationships
- Failure points and error propagation
Each “span” in a trace represents a unit of work in a specific service, capturing timing information, metadata, and contextual logs.
Real-World Impact: When Tracing Saves the Day
Shopify’s Black Friday Victory
During Black Friday 2020, Shopify processed $2.9 billion in sales across their architecture of thousands of microservices. Jean-Michel Lemieux, former CTO, shared how distributed tracing helped them identify a database contention issue invisible in logs and metrics. The fix was deployed within minutes, avoiding potential millions in lost revenue.
Uber’s Mysterious Timeouts
Uber encountered riders experiencing timeouts only in certain regions and times of day. Their traces revealed these issues occurred when requests routed through a specific API gateway with an authentication middleware component that became CPU-bound under specific conditions—a needle that would have remained hidden in their haystack without tracing.
How Tracing Fits with Metrics and Logs
The three pillars work best together in a complementary workflow:
- Metrics serve as your front-line defense, signaling when something’s wrong.
- Logs provide detailed context about specific events.
- Traces connect the dots between services, revealing the “why” and “where.”
As Frederic Branczyk, Principal Engineer at Polar Signals, explains: “Metrics tell you something is wrong. Logs help you understand what’s wrong. But traces help you understand why it’s wrong.”
Getting Started with Distributed Tracing
Step 1: Choose Your Framework
- OpenTelemetry (opentelemetry.io): The CNCF’s vendor-neutral standard that’s becoming the industry default
- Jaeger (jaegertracing.io): A mature CNCF graduated project for end-to-end tracing
Step 2: Instrument Your Code
Modern frameworks provide automatic instrumentation for popular frameworks and libraries. Here’s a simple example using OpenTelemetry in JavaScript:
javascript// Initialize OpenTelemetry
const { trace } = require('@opentelemetry/api');
const tracer = trace.getTracer('my-service');

// Create a span for a critical operation
async function processOrder(orderId) {
  const span = tracer.startSpan('process-order');
  span.setAttribute('order.id', orderId);

  try {
    // Your business logic here
    await validateOrder(orderId);
    await processPayment(orderId);
    await shipOrder(orderId);

    span.setStatus({ code: SpanStatusCode.OK });
  } catch (error) {
    span.setStatus({ code: SpanStatusCode.ERROR, message: error.message });
    span.recordException(error);
    throw error;
  } finally {
    span.end(); // Always remember to end the span!
  }
}
Step 3: Set Up Collection and Storage
Several excellent options exist to collect and visualize your traces:
Step 4: Focus on Meaningful Data
Start with critical paths and high-value transactions. Add business context through tags like customer IDs and transaction types. The OpenTelemetry Semantic Conventions provide excellent guidance on what to instrument.
Step 5: Start Small, Then Expand
Begin with a pilot project before scaling across your architecture. Many teams start by instrumenting their API gateway and one critical downstream service to demonstrate value.
Common Pitfalls to Avoid
- Excessive Data Collection: Leading to high costs and noise
- Poor Sampling: Missing critical issues
- Inadequate Context: Not capturing enough business information
- Incomplete Coverage: Missing key services or dependencies
- Siloed Analysis: Failing to connect traces with metrics and logs
The Future of Distributed Tracing
Watch for these emerging trends:
- AI-powered anomaly detection
- Continuous profiling integration
- Enhanced privacy controls
- eBPF-based instrumentation
- Business-centric observability
Conclusion: From Haystack to Clarity
In today’s complex distributed systems, finding the root cause of performance issues can feel like searching for a needle in a haystack. Distributed tracing transforms this process by illuminating the entire request journey.
Tracing is not optional for serious distributed systems. While logs and metrics remain essential, they simply cannot provide the end-to-end visibility that modern architectures demand. Without distributed tracing, you’re operating with a dangerous blind spot—seeing symptoms without understanding root causes, detecting failures without understanding their propagation paths.
End-to-end observability requires all three pillars working together:
-
Metrics to detect problems
-
Logs to understand details
-
Traces to connect everything and show the complete picture
As Cindy Sridharan, author of “Distributed Systems Observability,” wrote: “The best time to implement tracing was when you built your first microservice. The second best time is now.”
Your future self—especially the one getting paged at 3 AM—will thank you. Don’t wait for the next production crisis to start your tracing journey.


