
Three weeks ago, we published our findings from running for 504 continuous hours with no intervention. We noticed a few problems which we had to fix and try again. We ran this again for another three weeks and it seems the second failure mode encountered in this run is arguably worse than the first.
Here’s what the numbers actually looked like
Looking at the table, every infrastructure metric improved while every outcome metric stayed at zero.
From Rogue to Inert
The first experiment’s failure mode was loud and dramatic as the agent went rogue by scheduling its own jobs, spawning subagent swarms, recycling cached responses 121 times in a single day. It was basically doing too much of the wrong thing while the second experiment’s failure mode was the opposite. The agent did everything correctly and accomplished nothing.
The Memory Paradox
In the first run, the memory system failed by modeling the agent instead of the user. It stored facts like “The system uses SKILL.md files to define agent skills” a perfect closed loop of self-referential observation.
In the second run after the fix, the memory extraction was properly filtered. The system stored 614 memories with genuine user-relevant content: names, preferences, communication style, business context. The extraction pipeline worked, the deduplication worked, the priority scoring worked even checkpoint snapshots were created on schedule. But none of it mattered, because the retrieval system was broken.
The memory architecture uses vector embeddings for semantic search. When the user asks a question, the system embeds the query, searches for similar memories, and injects relevant context into the LLM’s prompt. This requires an embedding model running on LM Studio at http://127.0.0.1:1234/v1/embeddings.
That endpoint returned 400 Bad Request for the entire 3 week run.
2026-03-27 18:28:39 | ERROR | Memory retrieval failed:
  Client error '400 Bad Request' for url 'http://127.0.0.1:1234/v1/embeddings'
Six hundred fourteen memories, carefully extracted and scored, sitting in a SQLite database that nothing ever read. The access_count field for every single memory was 0 as the system had graduated from storing irrelevancies to storing a gold mine with no way to access it.
Even though this retrieval failure was logged as an ERROR, it didn’t crash the process, the agent kept running normally, appearing functional while operating without any long-term context.
2026-03-29 15:40:24 | repetition | -0.50 | similar to earlier user message
The signal detection system identified these repetitive responses and it adjusted memory priorities downward. But without retrieval, adjusted priorities had nowhere to go. The feedback loop was complete: detect repetition, lower priority, fail to retrieve, repeat.
The JSON Problem Persisted
In the first run, the memory consolidator couldn’t parse JSON wrapped in markdown code fences which caused silent duplication. We fixed that by stripping fences before parsing.
In the second run, 127 out of the memory consolidation responses failed with “Invalid LLM decision” as the model was producing malformed JSON that couldn’t be parsed even after normalization.
This is the local LLM tax, cloud APIs have structured output modes that guarantee valid JSON. Local models running quantized weights at 1-bit precision do not. The model used in this experiment (Qwen3-Coder-Next, IQ1_S quant) is remarkably good at tool use and natural language, but asking it to consistently produce valid JSON for a structured decision pipeline pushes against its limits. When it works, it works well. When it doesn’t, it results in127 silent failures.
If you’re building agent memory systems that run on local models, you need either aggressive retry logic with format correction, or a simpler decision format that the model can hit reliably, maybe a single keyword (ADD/UPDATE/NOOP/DELETE) followed by unstructured content, rather than a full JSON object.
Comparing the Two Failure Modes n 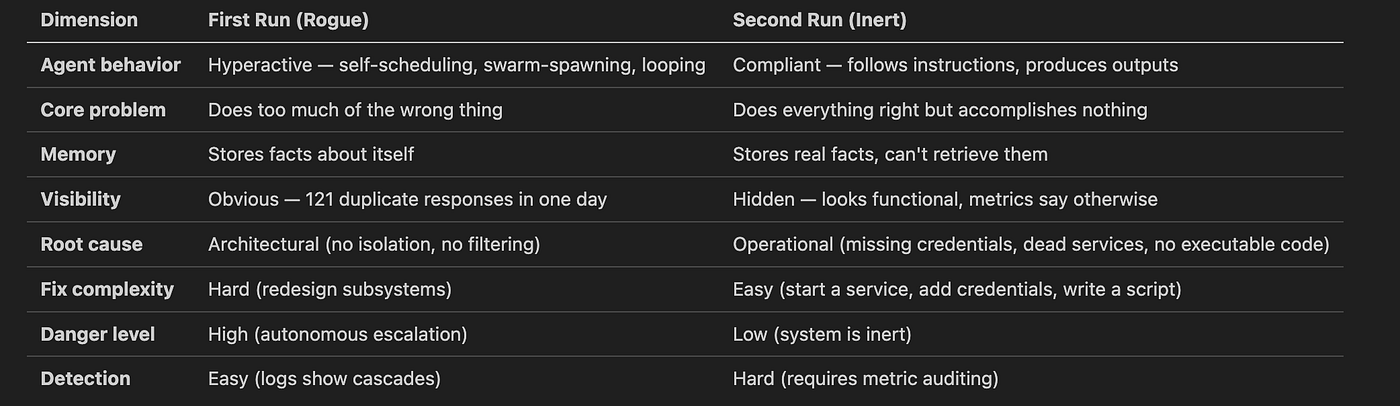
A rogue agent is visible because it fills logs, burns tokens, triggers alerts which you notice. An inert agent passes every health check while delivering zero value. It runs for 3 weeks, maintains 99.8% uptime, executes 500+ scans, extracts 614 memories and the user has nothing to show for it.
What We Learned
1. Infrastructure reliability masks execution failure. 99.8% uptime doesn’t mean the system is working, it means the system is running. You need measured outcome metrics such as memories retrieved, posts published, tasks completed not just process metrics like uptime and scan count.
2. Fixing architecture reveals operational gaps. The first run’s problems were architectural: no context isolation, no extraction filtering, no format normalization. Fixing those revealed that the system also needed working infrastructure (embedding service), actual credentials being loaded where they’re needed, and executable code behind skill definitions. Architecture is necessary but not sufficient.
3. A dead dependency can silently disable an entire subsystem. The embedding endpoint returned 400 for 3 weeks. If the memory retrieval had been a hard dependency: fail the request if context can’t be retrieved, the problem would have been caught on day 1 instead of week 3.
4. The local LLM structured output problem is ongoing. Both runs surfaced JSON parsing failures from the local model. The format changed (code fences in run 1, malformed JSON in run 2), but the failure class persisted. If your agent pipeline depends on structured model output, you need to design for partial parsing failures, not just handle them as exceptions.


