
Change point detection is a helpful tool that spots moments when data, such as stock prices or returns, suddenly shift, like changes in average, volatility, or trend. Recognizing these points helps us avoid assuming that history always repeats itself, highlights evolving patterns, and allows for more accurate analysis and timely adjustments before new market behaviors show up, especially in unpredictable environments.
It’s also useful in manufacturing, where sensor changes might signal potential faults, and in climate studies, where shifts in temperature or rainfall indicate significant change. In short, it’s about detecting when the familiar ends and exciting new patterns begin.
This article discusses change point detection with Python to identify regime shifts in financial time series of stocks and ETFs over the past 15 years. It involves computing features (log returns, volatility, volume, MA deviations), and plotting daily/monthly change points alongside events like COVID crashes, stock splits, and 2025 bull runs. Aimed at helping traders adapt strategies early.
Do you have to be a mathematician?
The math behind change point detection is quite fascinating, blending insights from statistics, optimisation, and signal processing to find where a series genuinely “break.”
It often involves working with likelihood functions, penalty terms for having too many segments, and various assumptions about the nature of the change — whether it’s a shift in mean, variance, trend, or something else.
Fortunately, there’s no need to build all this from scratch. The Python library ruptures simplifies these complex methods into a user-friendly interface, allowing access to several popular algorithms with only a few lines of code.
It’s a good choice because it’s flexible, well-documented, and tailored for time-series segmentation, enabling you to focus on analysing change points rather than dealing with complex math.
Let’s code
In our first example, we will get the daily prices of AAPL stock using the FMP API Stock Price and Volume Data and store them in a dataframe.
import requests
import pandas as pd
import numpy as np

token = '<YOUR FMP TOKEN>'

def get_historical_data(symbol, from_date, to_date):
    url = f'https://financialmodelingprep.com/api/v3/historical-price-full/{symbol}'
    querystring = {"apikey": token, "from": from_date, "to": to_date}
    resp = requests.get(url, querystring).json()
    df = pd.DataFrame(resp['historical'])
    df['date'] = pd.to_datetime(df['date'])
    df.set_index('date', inplace=True)
    df.sort_index(inplace=True)
    return df

symbol="AAPL"
from_date="2010-01-01"
to_date="2026-01-31"
df = get_historical_data(symbol, from_date, to_date)
Note: Replace with your actual FMP API key. If you don’t have one, you can obtain it by opening an FMP developer account.
This way, our df contains the OHLC prices of Apple stock from 2010. The next step is to compute some features for use in our example. For this article, we will calculate:
- Log Return
- Rolling Volatility
- Rolling Average Volume
- Difference of the adjusted close price to the 50-day moving average
You will notice that most of our code is written with functions so we can reuse it later and investigate other stocks or ETFs.
def add_changepoint_features(
        df: pd.DataFrame,
        adjclose_col: str = "adjClose",
        volume_col: str = "volume",
        vol_window: int = 20,
        vol_annualization: int = 252,
        avg_volume_window: int = 5,
        ma_window: int = 50,
        set_date_as_index: bool = True,
        sort_index: bool = True,
        inplace: bool = False,
) -> pd.DataFrame:
    out = df if inplace else df.copy()

    out["log_return"] = np.log(out[adjclose_col] / out[adjclose_col].shift(1))  # Log returns (stationary signal)
    out["return"] = out[adjclose_col].pct_change()  # Simple returns
    out["rolling_volatility_20"] = out["return"].rolling(vol_window).std() * np.sqrt(
        vol_annualization)  # 20-day ann. volatility
    out["rolling_avg_volume_5"] = out[volume_col].rolling(
        avg_volume_window).mean()  # Rolling average volume (last 5 days)
    out["ma_50_adjclose"] = out[adjclose_col].rolling(ma_window).mean()  # 50-day moving average of adjClose
    out["adjclose_diff_from_ma50"] = out[adjclose_col] - out["ma_50_adjclose"]  # Difference from 50-day MA

    if sort_index:
        out.sort_index(inplace=True)

    return out

df = add_changepoint_features(df, inplace=True)
We will now define a list of features to detect changepoints.
features = ['log_return', 'rolling_volatility_20', 'rolling_avg_volume_5', 'adjclose_diff_from_ma50']
Let’s detect some change points
Now is the time for all the fun! We’ll create a function that takes a dataframe and the feature to analyze. Using the ruptures library we mentioned earlier, this function will detect changepoints and display them on a single graph.
We won’t explore ruptures in detail, but let’s clarify the key terms from our detection function and why I selected these specific settings for trading data.
Binseg (Binary Segmentation) is an efficient algorithm for identifying multiple change points in signals. It finds the best break using dynamic programming, splits the signal, and recurses until no significant improvement occurs. It suits daily financial series with thousands of points without heavy computation.
It may detect fewer breaks than requested if further splits don’t improve the fit, which is common in noisy returns dominated by major regimes.
model=”l2″: The cost function measures segment fit. l2 (least-squares: sum of squared errors to mean) excels at detecting mean shifts, volatility, or MA deviations in Gaussian-like noise typical in finance. I chose it over “l1” (your robust) or “rbf” (smooth) because trading features rarely have heavy outliers after rolling windows, and l2 is fastest.
n_bkps=3 targets 3 change points (4 regimes) to balance major shifts (2010–2026) without overfitting noise. Lower (1–2) catches bull/bear eras; higher risks spurious breaks. Binseg may return 2 if data has few regimes — outputs indices ending at signal length, so plots real breaks only. We chose 3 as it reliably surfaces 2–3 key events (e.g., COVID, splits) across assets.
import ruptures as rpt
import matplotlib.pyplot as plt
import matplotlib.dates as mdates
import pandas as pd
import numpy as np

def detect_and_plot_changepoints(df, feature_col, n_bkps=3, figsize=(12, 5),
                                 title_suffix='', save_path=None):
    feat_clean = df[feature_col].dropna()
    if len(feat_clean) < 50:
        print(f"Warning: {feature_col} has <50 points, skipping.")
        return None

    signal = feat_clean.values
    date_idx = feat_clean.index

    algo = rpt.Binseg(model="l2").fit(signal)
    bkps_binseg = algo.predict(n_bkps=n_bkps)
    bkp_dates = [date_idx[i] for i in bkps_binseg[:-1]]

    print(f"Binseg '{feature_col}': {bkp_dates}")

    fig, ax = plt.subplots(figsize=figsize)
    x_dates = mdates.date2num(date_idx)  # Convert dates to matplotlib nums
    ax.plot(x_dates, signal, label=feature_col, linewidth=1)

    bkp_x = mdates.date2num(bkp_dates)
    for bkp_num in bkp_x:
        ax.axvline(bkp_num, color="red", ls="--", lw=2, alpha=0.8)

    ax.set_xlabel('Date')
    ax.xaxis.set_major_locator(mdates.YearLocator())
    ax.xaxis.set_major_formatter(mdates.DateFormatter('%Y'))
    ax.xaxis.set_minor_locator(mdates.MonthLocator(interval=6))
    plt.xticks(rotation=45)

    ax.set_title(f'Changepoints: {feature_col}{title_suffix}')
    ax.set_ylabel('Value')
    ax.legend()
    ax.grid(True, alpha=0.3)
    plt.tight_layout()

    if save_path:
        plt.savefig(save_path, dpi=150, bbox_inches="tight")

    plt.show()

    return {'feature': feature_col, 'bkp_dates': bkp_dates}


results = []
for feature in features:
    res = detect_and_plot_changepoints(df, feature, n_bkps=2)
    if res:
        results.append(res)

summary_df = pd.DataFrame(results)
print("nSummary:")
print(summary_df)
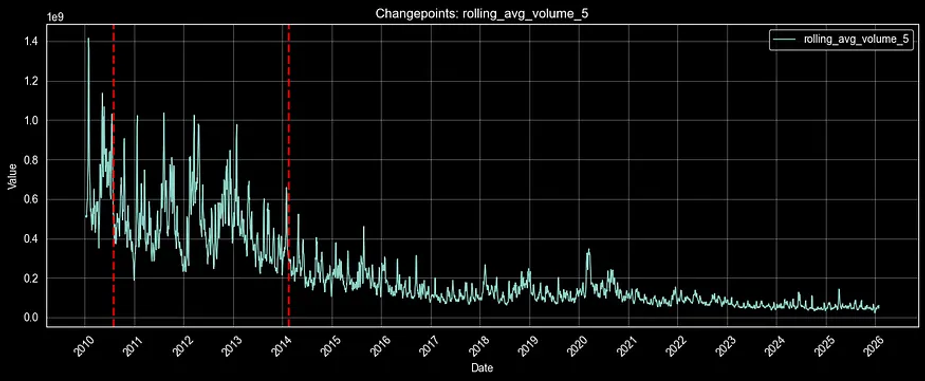
Running the above code produces 4 plots, each with a red line indicating change points, along with a summary table listing the exact change dates for each feature.


And the summary table:
Summary:
                   feature                                   bkp_dates
0               log_return  [2011-12-20 00:00:00, 2012-04-10 00:00:00]
1    rolling_volatility_20  [2018-10-12 00:00:00, 2023-01-30 00:00:00]
2     rolling_avg_volume_5  [2010-07-30 00:00:00, 2014-02-12 00:00:00]
3  adjclose_diff_from_ma50  [2025-07-07 00:00:00, 2025-12-17 00:00:00]
AAPL’s daily change points reveal key market shifts. Log returns marked important dates like 2011–12–20 and 2012–04–10, indicating recovery after 2011’s correction and gains before the iPad 3 launch and strong Q1 2012 earnings that boosted sentiment. Volatility changed notably on 2018–10–12 during a tech selloff amid Fed tightening. Volume trends from 2010–07–30 to 2014–02–12 reflected Apple’s stock split and rising institutional flows driven by iPhone sales.
One interesting thing would be to resample our dataframe to monthly and see what is going on:
df = df.resample("M").agg(
    open=("open", "first"),
    high=("high", "max"),
    low=("low", "min"),
    close=("close", "last"),
    adjClose=("adjClose", "last"),
    volume=("volume", "sum"),
    unadjustedVolume=("unadjustedVolume", "sum"),
)

df = add_changepoint_features(df, inplace=True)

results = []
for feature in features:
    res = detect_and_plot_changepoints(df, feature, n_bkps=2)
    if res:
        results.append(res)

# Summary table
summary_df = pd.DataFrame(results)
print("nSummary:")
print(summary_df)
The summary table will display the following:
Summary:
                   feature                                   bkp_dates
0               log_return  [2012-03-31 00:00:00, 2013-06-30 00:00:00]
1    rolling_volatility_20  [2018-10-31 00:00:00, 2024-03-31 00:00:00]
2     rolling_avg_volume_5  [2014-02-28 00:00:00, 2016-08-31 00:00:00]
3  adjclose_diff_from_ma50  [2020-05-31 00:00:00, 2022-06-30 00:00:00]
AAPL’s monthly change points differ from daily ones because aggregation smooths out short-term noise into broader trends. The main differences occur in Volume, showing delays until 2014–02–28 (7:1 stock split surge) and 2016–08–31 (post-split normalization), reflecting structural liquidity shifts.
Additionally, MA deviations highlight key dates such as 2020–05–31 (post-COVID tech bull) and 2022–06–30 (peak-to-trough of the bear market), indicating medium-term trends over short-term mean reversion.
Both daily and monthly analyses identify key events such as the 2018 volatility spikes (tech/Fed selloff), COVID impacts, stock splits, and recent shifts in 2025 momentum. This demonstrates that change point detection consistently detects major regime shifts across different timeframes.
What about other assets?
As you can understand, change point detection has an indefinite number of possible scenarios, so each trader should determine which features and timeframes best suit their trading strategy.
S&P 500
Let’s explore additional asset types to see what results we get. First, we’ll run the same code with the SPY ETF, which tracks the S&P 500.
symbol="SPY"
from_date="2010-01-01"
to_date="2026-01-31"
df = get_historical_data(symbol, from_date, to_date)
df = add_changepoint_features(df, inplace=True)

results = []
for feature in features:
    res = detect_and_plot_changepoints(df, feature, n_bkps=2)
    if res:
        results.append(res)

# Summary table
summary_df = pd.DataFrame(results)
print("nSummary:")
print(summary_df)
We won’t overwhelm you with many graphs, so let’s immediately review the summary report.
Summary:
                   feature                                   bkp_dates
0               log_return  [2010-06-21 00:00:00, 2010-07-06 00:00:00]
1    rolling_volatility_20  [2020-02-21 00:00:00, 2020-05-04 00:00:00]
2     rolling_avg_volume_5  [2012-07-02 00:00:00, 2016-03-22 00:00:00]
3  adjclose_diff_from_ma50  [2025-03-04 00:00:00, 2025-05-07 00:00:00]
SPY’s daily change points highlight vital shifts in the S&P 500 regime. Log returns identify key periods from 2010–06–21 to 2010–07–06, capturing the aftermath of the Flash Crash and the swift rebound from panic selling to recovery buying within days.
Volatility breaks at 2020–02–21 and 2020–05–04 signal the extremes of the COVID crash, followed by volatile stabilisation into May. Volume shifts from 2012–07–02 to 2016–03–22 reflect the surge in ETF adoption, with SPY volumes permanently increasing as a retail and institutional liquidity vehicle before reaching maturity.
Recent MA deviations indicate early-2025 trend shifts in macro policy, moving from an MA uptrend to mean reversion.
Energy
Next, we test symbol XLE, which is the State Street Energy Select Sector SPDR ETF, which tracks major U.S. energy companies like Exxon and Chevron. Energy experiences sharp regime changes during commodity crashes (e.g., COVID oil collapse), OPEC volatility, or energy-transition shifts, making it more event-driven than broad indices. n
Summary:
                   feature                                   bkp_dates
0               log_return  [2020-02-24 00:00:00, 2020-03-23 00:00:00]
1    rolling_volatility_20  [2020-02-21 00:00:00, 2020-07-08 00:00:00]
2     rolling_avg_volume_5  [2020-02-27 00:00:00, 2022-11-29 00:00:00]
3  adjclose_diff_from_ma50  [2020-11-11 00:00:00, 2022-06-15 00:00:00]
XLE’s daily change points capture energy sector turmoil. Log returns flag 2020–02–24 to 2020–03–23, pinpointing the COVID oil crash when prices collapsed amid demand destruction.
Volatility spans 2020–02–21 to 2020–07–08, covering the full shock — panic selling and OPEC+ battles. Volume surges 2020–02–27 to 2022–11–29 reflect pandemic-era focus, with elevated hedging/speculative/ETF flows during energy transition debates before stabilization
Aerospace & Defense
Next, we examine XAR — the State Street SPDR S&P Aerospace & Defense ETF, which tracks U.S. aerospace and defense companies like Lockheed and RTX. This sector is particularly responsive to geopolitical tensions, defense spending, and government contracts. It tends to experience notable shifts during wars, elections, or travel disruptions such as COVID-19’s impact on aviation. n
Summary:
                   feature                                   bkp_dates
0               log_return  [2025-03-26 00:00:00, 2025-04-09 00:00:00]
1    rolling_volatility_20  [2020-02-27 00:00:00, 2020-07-07 00:00:00]
2     rolling_avg_volume_5  [2016-11-04 00:00:00, 2020-09-22 00:00:00]
3  adjclose_diff_from_ma50  [2025-04-29 00:00:00, 2026-01-08 00:00:00]
XAR’s daily change points reveal aerospace & defence trends. Log returns from 2025–03–26 to 2025–04–09 indicate a sharp rise during the 2025 defence rally amid geopolitical tensions and strong orders. Volatility spikes between 2020–02–27 and 2020–07–07 due to COVID shocks. Volume increases from 2016–11–04 to 2020–09–22 reflect multi-year ETF interest linked to elections, geopolitics, and macro hedging before normalisation.
The most precious of them all… Gold!
Finally, GLD, the SPDR Gold Shares ETF, the world’s largest physically-backed gold tracker that moves with spot gold prices, central bank flows, and safe-haven demand. Gold’s regimes differ sharply from equities: expect long volatility uptrends (inflation/geopolitical eras), volume surges (crises/ETF booms), and sustained bull trends decoupled from stocks. So let’s see what the changepoints are: n
Summary:
                   feature                                   bkp_dates
0               log_return  [2025-08-20 00:00:00, 2026-01-28 00:00:00]
1    rolling_volatility_20  [2014-01-15 00:00:00, 2025-04-09 00:00:00]
2     rolling_avg_volume_5  [2011-12-23 00:00:00, 2025-09-02 00:00:00]
3  adjclose_diff_from_ma50  [2024-03-04 00:00:00, 2025-09-02 00:00:00]
GLD’s change points spotlight gold’s 2025–2026 bull run. Log returns nail 2025–08–20 to 2026–01–28 — the core surge on geopolitical risks, central bank buying, and ETF inflows, marking sustained high returns.
MA deviations (2024–03–04 to 2025–09–02) confirm the structural uptrend above 50-day average with late-2025 cooling but no breakdown — proving detection catches gold’s defining momentum shift.
Final Thoughts
This analysis demonstrates how tailored features reveal insights into change points. Log returns identify sharp momentum surges (e.g., AAPL’s 2012 rally, gold’s 2025 bull run). Rolling volatility detects macro shocks (COVID crashes in SPY/XLE). Volume indicates liquidity regimes (ETF surges in SPY/GLD). Moving Average deviations signal trend persistence or reversals (defence 2025 uptrend).
Key Takeaways:
- Detect regimes early to adapt strategies before drawdowns hit.
- Mix features/timeframes for robust, multi-angle market views.
- Works on stocks, ETFs, and gold. Every time series is a possible investigation area
You may explore numerous scenarios. Use FMP’s APIs to download fundamental historical data like EPS or analysts’ ratings to create time series and backtest.
Run weekly scans across your portfolio for fresh change points. Swap Binseg for Pelt when you need exact breaks without early stopping. Experiment with custom features (RSI divergence, VIX ratio) or shorter windows (10-day vol) on your personal holdings to uncover hidden regime shifts tailored to your strategy.
And don’t forget: “Markets change; so must you.” Adapt or repeat history.


